

Why This Matters
Global finance leaders, from the International Finance Corporation to national treasuries, are actively working to dismantle the ‘Africa risk premium,’ the inflated borrowing costs imposed when markets treat diverse African economies as a single high-risk story. But while institutions open credit databases and deploy guarantees to lower capital costs, the energy models guiding national roadmaps remain stuck on autopilot. Continuing to plug generic or flat WACC assumptions into energy models creates a dangerous disconnect: it produces paper-optimal plans that fail commercial bankability tests, misguide climate finance, and obscure the massive financial payoff of domestic policy reforms. Without measuring and tracking capital costs, “de-risking” remains a slogan rather than a measurable strategy. This is fixable. Once WACC is measured rather than assumed, it becomes a variable that governments, regulators, and financiers can actively reduce.
Africa’s Energy Planning Stands on Shaky Cost-of-Capital Assumptions
Governments use energy systems models to make important decisions about what energy infrastructure to fund, where, and on what timeline. To estimate the projected costs of those investments in their models, they often rely on the weighted average cost of capital, or WACC. In plain terms, WACC is the blended price of money for a project, including the interest lenders charge and the return equity investors expect, weighted by their shares. Because power plants are often paid off over decades, this one number often matters more to lifetime cost than the hardware. A $100 million solar plant costs about $160 million to pay off over 20 years at 5% WACC, typical for Europe, and about $320 million at 15% WACC, closer to commercial rates in much of Africa.
The real-world cost of capital varies widely depending on the country, the technology, the developer, and the lender. But in their projections, modelers frequently rely on static, imported literature defaults or uniform WACC rates — ignoring local variability. This simplification produces energy investment plans that look optimal on paper but struggle to attract capital in the real world. Modeling with unexamined cost-of-capital is standard practice worldwide, but this shortcut is uniquely dangerous in Africa, where projects are mostly greenfield and financing costs vary widely1 and run two to three times higher2 than in advanced economies. In practice, models make three recurring errors: (i) generic default rates that bear little relation to local markets; (ii) one uniform rate across countries and technologies that differ enormously in risk; and (iii) a rate held fixed over time, so the payoff from reform never shows up. The next section shows what each does to real investment decisions.
Getting the Cost of Capital Wrong Means Getting Investment Decisions and Priorities Wrong
WACC is not a background detail. It shapes investment options and decisions. And getting it wrong hurts power markets in the following ways:
- Assumed, below-market WACC rates on paper create a bankability gap in real life. Modelers often plug in a literature default, typically 10%. In higher-risk Eastern, Western, and Central African markets, where commercial capital costs more than 15%, that understates real costs. In lower-risk North Africa, it sometimes overstates them. International Energy Agency (IEA) survey evidence3 puts utility-scale solar WACC in Kenya and Senegal around 9% with concessional backing but above 15% in local commercial markets. The gap matters! Raising a model’s WACC from 9% to 15% lifts the 20-year cost of a stylized $100 million solar project from roughly $220 million to $320 million, an increase equal to the plant’s entire upfront cost. When governments build national roadmaps or Integrated Resource Plans on these unrealistic figures, they publish paper-optimal pathways that fail the moment they reach commercial markets. A plan shouldn’t be judged by whether it optimizes elegantly, but by whether it can survive contact with real-world investors, utilities, and public budgets.
- One rate for every country and technology skews the choice between them. The International Renewable Energy Agency’s (IRENA) report4 for Africa’s Continental Master Plan applies a flat 10% financing rate across the continent, although actual borrowing costs range from single digits in North Africa to over 20% in higher-risk markets. The same flattening across technologies matters because they respond differently to the cost of money. Solar, wind, and storage pay most of their cost upfront, so expensive capital hits them hardest, while diesel and gas defer costs into fuel bills that a high discount rate shrinks. A single rate therefore errs in whichever direction it is wrong, making renewable-heavy pathways look cheaper than financiers will accept when it is low, and tilting plans back toward diesel and gas when it is bluntly high.
- Generic WACC rates distort off-grid and electrification strategies. Off-grid projects, and mini-grids in particular, face far higher financing costs than models assume, up to 32% in some markets. Research shows that when electrification models5 use country- and technology-specific financing costs instead of one uniform rate, mini-grids lose much of their apparent advantage: around 240 million people who looked cheapest to serve with mini-grids are cheaper to serve with stand-alone systems, and uniform-rate plans would deliver electricity at roughly 20% higher cost per kilowatt-hour. That is not a minor sensitivity test; it is a different access strategy.
- Uniform and static rates misstate the pace of decarbonization. Research6 on the impact of finance on climate investment in developing economies shows that when region-specific financing conditions are introduced into global decarbonization modeling, the low-carbon electricity Africa is projected to generate in 2050 under a cost-optimal 2°C pathway is 35%7 lower than when a single global rate is assumed. The cheap-money version counts on buildouts commercial markets would never finance. The same study finds that lower financing costs could allow Africa to reach net zero about a decade earlier.8 Financing conditions therefore influence not only what gets built, but how quickly the transition can occur, and modeling WACC explicitly shows climate funders where their money has the highest impact.
- Static WACC values hide the financing payoff from policy reform. Many models keep WACC constant across time and across technologies. But IEA evidence9 shows that country risk, off-taker weakness, regulatory uncertainty, transmission constraints, and currency structures all shape project finance outcomes, and each responds to policy reform. A model holding WACC fixed cannot reflect the payoff from the very reforms policymakers are striving to deliver. The most valuable lever planners hold, reducing risk, is invisible in the tool they plan with.
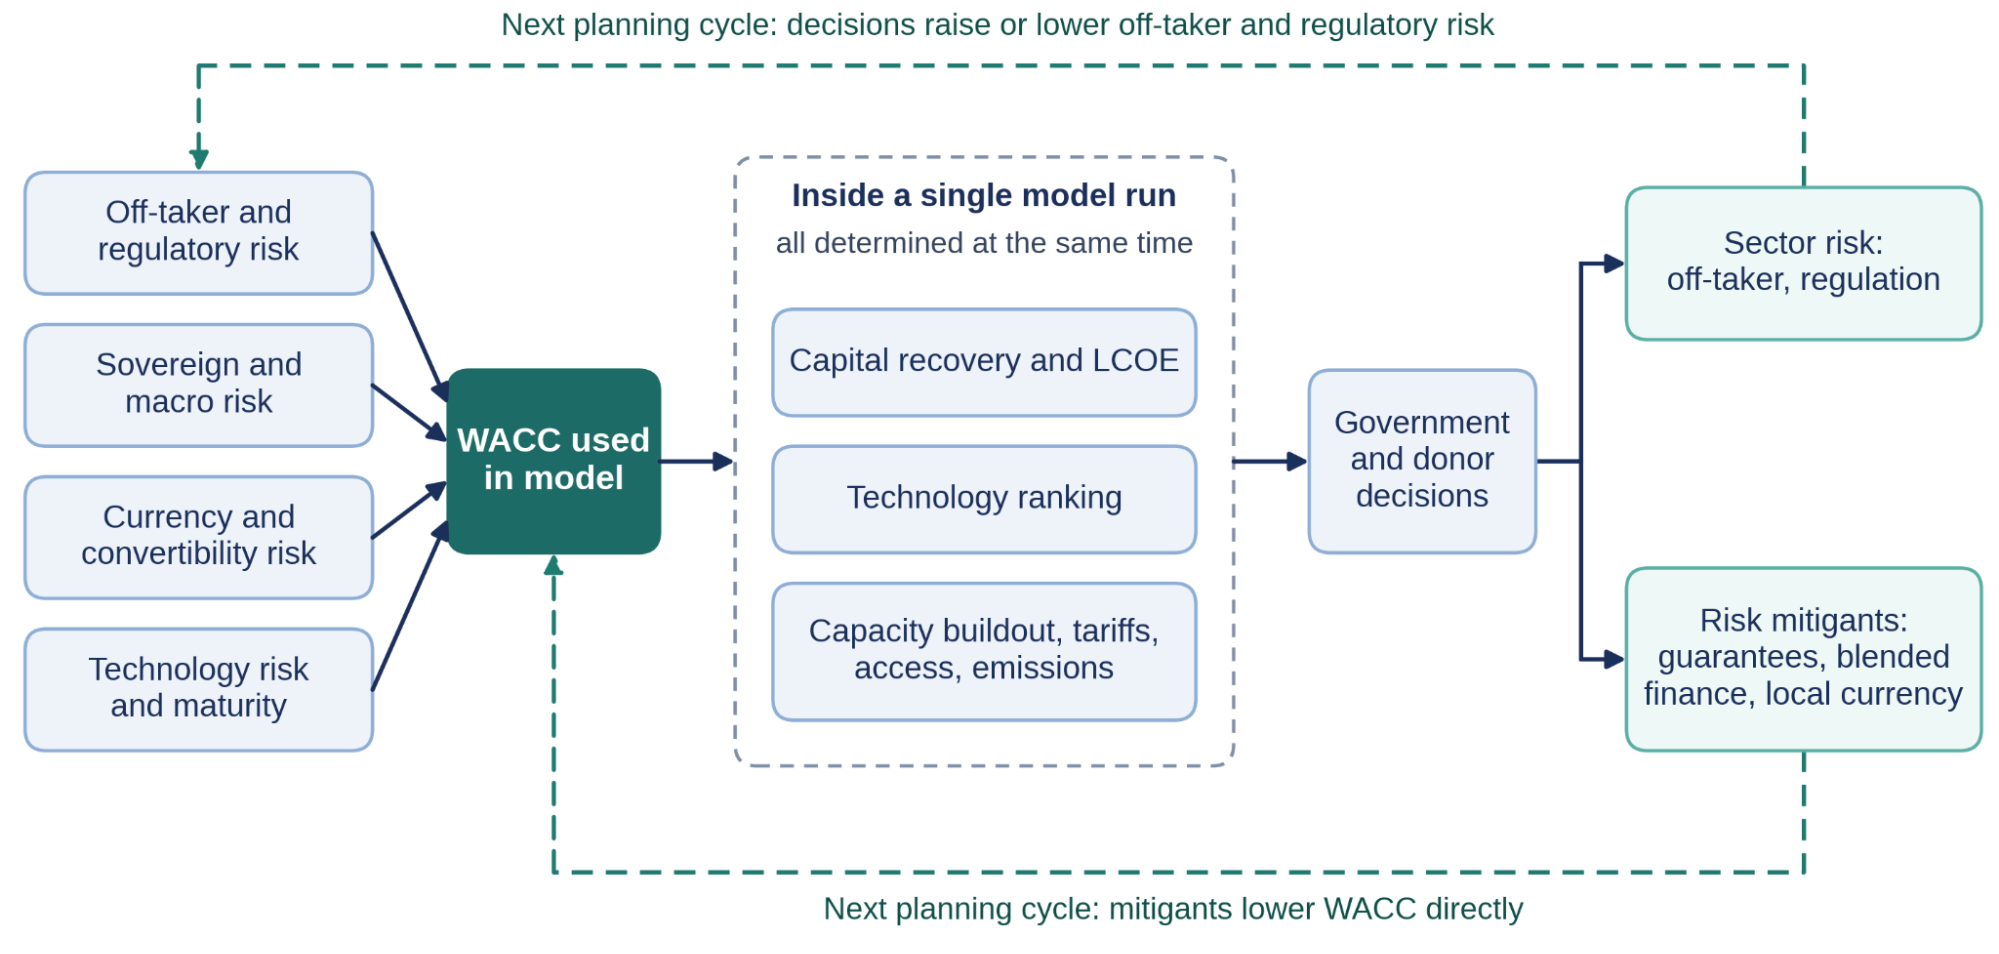
FIGURE 1: Conceptual feedback loop showing how WACC shapes energy modeling outcomes in African energy systems. Sovereign, currency, off-taker, regulatory, and technology risk sets affect the WACC used in models, which, within a single model run, simultaneously determines capital recovery, the ‘Levelized Cost of Energy,’ or the average cost of every unit of electricity the plant produces over its lifetime, technology ranking, and ultimately capacity buildout, tariffs, access, and emissions. These outcomes shape government and donor decisions, which in turn change sector risk and the use of risk mitigants such as guarantees, blended finance, and local-currency instruments. In the next planning cycle, shifts in off-taker and regulatory risk can raise or lower WACC, while mitigants lower it directly. Source: Authors’ illustration.
Energy Modelers Should Measure WACC, Not Assume It
- Replace uniform discount rates with country- and technology-specific WACCs. Modelers should source values and insights from published authoritative datasets such as the IEA’s Cost of Capital Observatory (which tracks country- and asset-specific rates),10 Steffen et al. (global project-level WACC data),11 CATF (bottom-up African power sector estimations),12 IRENA’s Cost of Financing for Renewable Power dataset (survey-based technology spreads across 100+ markets),13 or other published authoritative datasets. For missing data, follow a documented fallback hierarchy: 1) observed values, 2) first-principles build-up (sovereign yield + risk premiums), 3) country proxies, or 4) regional averages. Explicitly state and sensitivity-test whichever tier is used.
- Run dynamic WACC sensitivities to reveal reform leverage. Every least-cost modeling exercise for Africa should evaluate at least three scenarios: commercial market rates (to establish the current real-world baseline), blended concessional financing (to isolate the immediate impact of donor de-risking and guarantees), and a policy reform trajectory (to capture the long-term capital savings unlocked by utility, off-taker, and regulatory improvements). Evaluating these three pathways shows policymakers and development finance institutions (DFIs) the exact financial value of pulling each leverage point over time.
Policymakers and Development Financiers Should Use Measured WACC to Target Reforms and Track Their Payoff
Once WACC is treated as a measurable, country-specific metric rather than a placeholder, it becomes something policymakers, regulators, and DFIs can work to reduce. The actions below show where that leverage lies, and a model that breaks WACC into its components can show what each is worth.
- Mandate WACC transparency as a condition for project finance. Climate funds, DFIs, and government procurement agencies should require all large-scale energy deals to publicly report baseline capital costs and target WACC reductions. Just as environmental and social safeguards are now mandatory for project approval, financial disclosure must become standard so regulators, investors, and planners can see the real cost of capital.
- Decompose WACC into its core drivers to match risks with the right actors. Modelers should calculate and report foreign exchange and off-taker risk as separate line-item premiums rather than burying them in a single lump-sum rate. Exposing these distinct components allows each stakeholder to deploy targeted solutions: DFIs can target currency risk by expanding local-currency lending instruments (as demonstrated by South Africa).14 Governments and regulators can target off-taker risk, which adds a 5- to 7-percentage-point surcharge on the continent, where only Botswana and Mauritius hold investment-grade ratings,15 by enacting tariff adjustments, payment security mechanisms, and utility governance reforms.
- Treat WACC reduction as an explicit development goal, not a passive byproduct. De-risking instruments, such as the World Bank’s political risk insurance,16 the Africa Energy Guarantee Facility,17 and partial risk guarantees, deliver their value primarily by lowering WACC. Rather than evaluating these tools only on the dollar amounts deployed, DFIs and donors should track and report their direct impact on lowering capital costs across prioritized projects.
Conclusion
Treating WACC as a dynamic, country-specific variable gives African governments, donors, and investors a shared metric to target currency risk, strengthen off-taker creditworthiness, and lower energy costs. Some of the data now exist, from the IEA’s Cost of Capital Observatory to Clean Air Task Force’s country-level estimates for the whole continent; what remains is to put them into the models that decide what gets built. African energy models must stop assuming bankability and start measuring the real cost of capital.
Endnotes
- Clean Air Task Force. (2024). Evaluating the Weighted Average Cost of Capital (WACC) in the Power Sector for African Countries. CATF Report. https://www.catf.us/resource/evaluating-weighted-average-cost-capital-wacc-power-sector-african-countries/
- International Energy Agency. (2022). Cost of Capital Observatory. IEA, World Economic Forum, ETH Zurich, and Imperial College London. https://www.iea.org/reports/cost-of-capital-observatory
- Stedile, A., & Gordon, E. (2025). How a high cost of capital is holding back energy development in Kenya and Senegal. International Energy Agency (IEA) Commentary. https://www.iea.org/commentaries/how-a-high-cost-of-capital-is-holding-back-energy-development-in-kenya-and-senegal
- International Renewable Energy Agency. (2024). Advancements in continental power system planning for Africa: Methodological framework of the African Continental Power Systems Masterplan’s SPLAT-CMP model 2023. IRENA Report. https://www.irena.org/-/media/Files/IRENA/Agency/Publication/2024/Jul/IRENA_Advancements_CMP_Africa_2024.pdf
- Agutu, C., Egli, F., Williams, N. J., Schmidt, T. S., & Steffen, B. (2022). Accounting for finance in electrification models for sub-Saharan Africa. Nature Energy, 7(7), 631–641. https://www.nature.com/articles/s41560-022-01041-6
- Ameli, N., Dessens, O., Winning, M., Cronin, J., Chenet, H., Drummond, P., Calzadilla, A., Anandarajah, G., & Grubb, M. (2021). Higher cost of finance exacerbates a climate investment trap in developing economies. Nature Communications, 12, Article 4046. https://www.nature.com/articles/s41467-021-24305-3
- Ameli, N., Dessens, O., Winning, M., Cronin, J., Chenet, H., Drummond, P., Calzadilla, A., Anandarajah, G., & Grubb, M. (2021). Higher cost of finance exacerbates a climate investment trap in developing economies. Nature Communications, 12, Article 4046. https://www.nature.com/articles/s41467-021-24305-3
- Ameli, N., Dessens, O., Winning, M., Cronin, J., Chenet, H., Drummond, P., Calzadilla, A., Anandarajah, G., & Grubb, M. (2021). Higher cost of finance exacerbates a climate investment trap in developing economies. Nature Communications, 12, Article 4046. https://www.nature.com/articles/s41467-021-24305-3
- Stedile, A., & Gordon, E. (2025). How a high cost of capital is holding back energy development in Kenya and Senegal. International Energy Agency (IEA) Commentary. https://www.iea.org/commentaries/how-a-high-cost-of-capital-is-holding-back-energy-development-in-kenya-and-senegal
- International Energy Agency. (2022). Cost of Capital Observatory. IEA, World Economic Forum, ETH Zurich, and Imperial College London. https://www.iea.org/reports/cost-of-capital-observatory
- Steffen, B., Egli, F., Gumber, A., Ðukan, M., & Waidelich, P. (2025). A global dataset of the cost of capital for renewable energy projects. Scientific Data / Nature, 12, Article 5912. https://www.nature.com/articles/s41597-025-05912-x
- Clean Air Task Force. (2024). Evaluating the Weighted Average Cost of Capital (WACC) in the Power Sector for African Countries. CATF Report. https://www.catf.us/resource/evaluating-weighted-average-cost-capital-wacc-power-sector-african-countries/
- International Renewable Energy Agency. (2023). The cost of financing for renewable power. IRENA Report. https://www.irena.org/Publications/2023/May/The-cost-of-financing-for-renewable-power
- South Africa’s REIPPPP: The Renewable Energy Independent Power Producer Procurement Programme (REIPPPP), launched in 2011, is a competitive auction in which private developers bid to build renewable projects backed by standardized 20-year contracts, a sovereign payment guarantee, and financing raised largely in local currency. Over successive rounds, competition drove solar tariffs down roughly 75%. Its ingredients are institutional choices rather than South African peculiarities, which is why countries such as Zambia and Senegal have adapted the model. Risk premiums respond directly to institutional design.
- Stedile, A., & Gordon, E. (2025). How a high cost of capital is holding back energy development in Kenya and Senegal. International Energy Agency (IEA) Commentary. https://www.iea.org/commentaries/how-a-high-cost-of-capital-is-holding-back-energy-development-in-kenya-and-senegal
- Multilateral Investment Guarantee Agency. (2023). Political Risk Insurance Framework and Overview. World Bank Group. https://www.miga.org/political-risk-insurance
- European Investment Bank & Global Development Network. (2021). Potential Impact of the Africa Energy Guarantee Facility (AEGF). EIB-GDN Working Paper. https://www.eib.org/files/publications/eib_gdn_working_paper_aegf_en.pdf