

BLUF: African energy projects are often financed in foreign currency and face high capital costs, largely due to exchange rate volatility risks. This stifles investment. New analysis quantifies for the first time that shifting project finance to local currency—with complementary policies and de-risking tools—can reduce capital cost by up to 31% and provide electricity cost savings of up to 29%.
Why it matters: Africa’s energy sector is trapped in a cycle of high costs and underinvestment, especially in clean energy which typically requires higher upfront capital and is reliant on foreign financing. Between 2005–2025, the continent attracted less than 1.5% of global renewable energy investment. Without new financing approaches, energy projects in Africa will remain expensive, delaying the continent’s energy access and economic development goals. This memo provides real-life and modelled evidence for how local currency paired with complementary policies and tools can lower costs and increase investment.
Africa’s energy infrastructure has a high capital cost problem
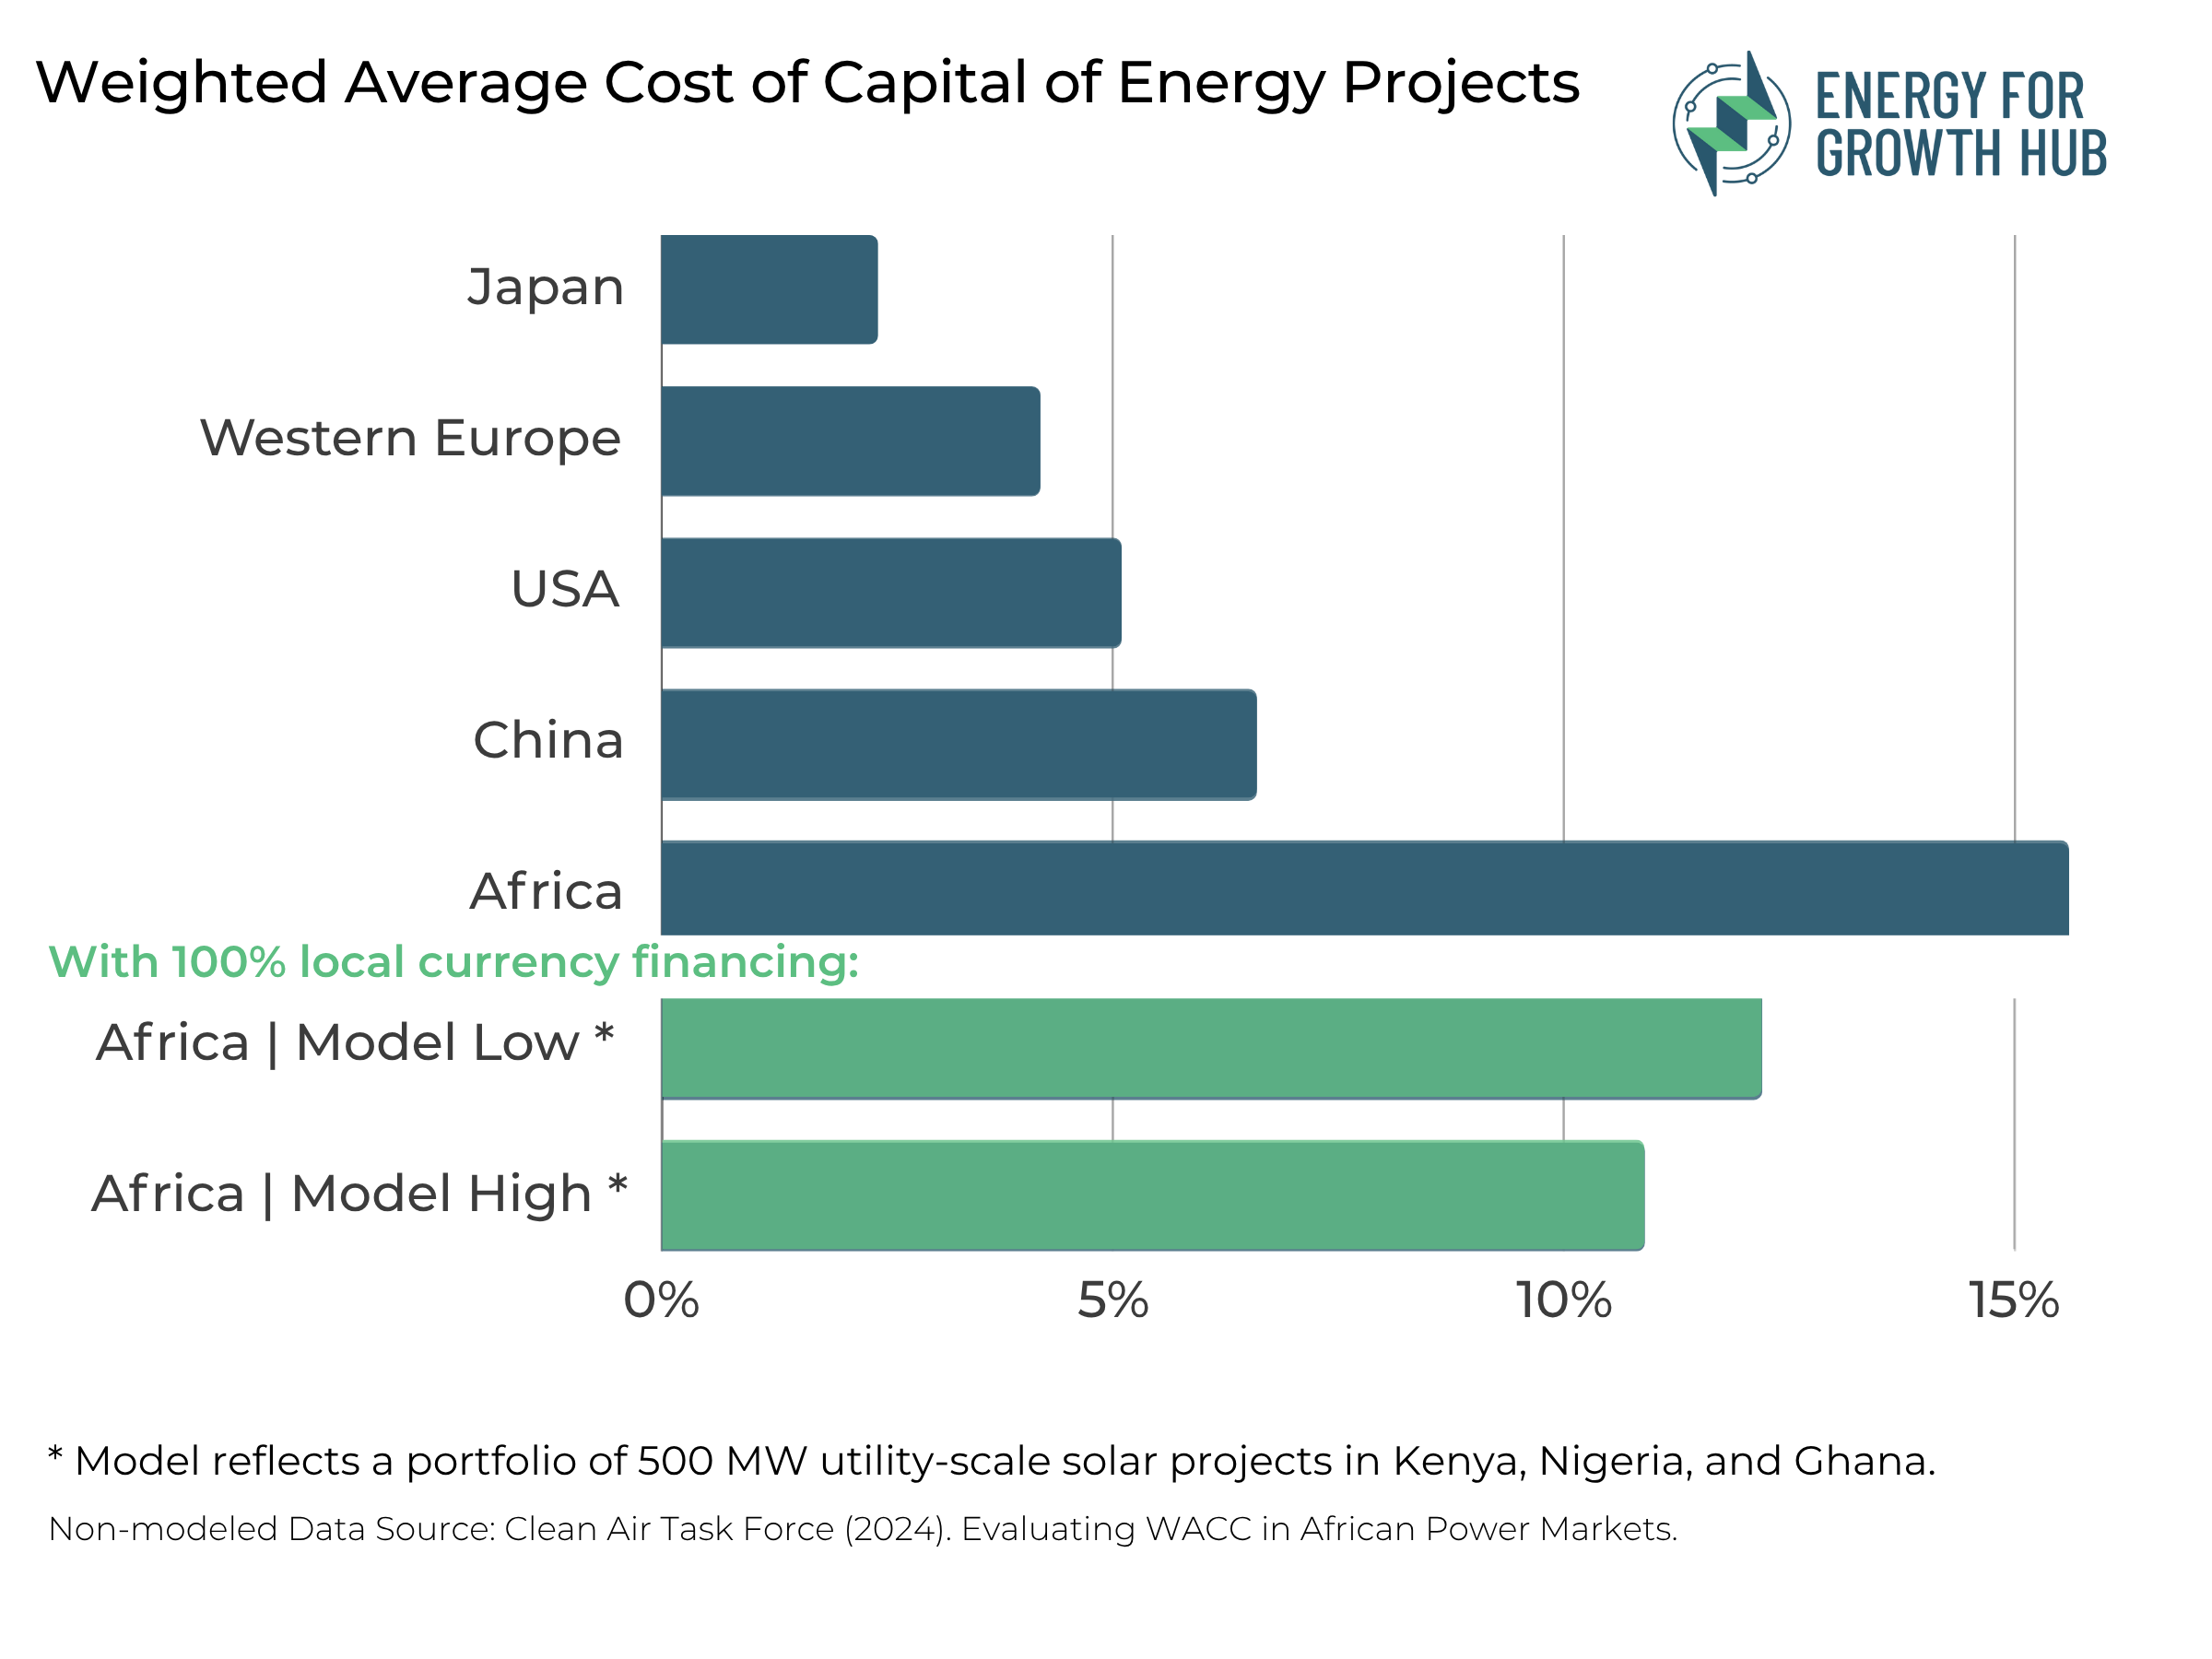
Energy projects in Africa face a much higher cost of capital than those in other regions: the weighted average cost of capital (WACC) is 15.6% in Africa, compared to just 2.4% in Japan and 5.1% in the U.S. This elevated WACC is driven by several factors: high sovereign and utility debt burdens, the inability of most utilities to recover operating and servicing costs through tariffs, regulatory and policy uncertainty, lack of transparency and standardization in contract negotiation, and the limited depth of local capital markets, which constrains the availability of long-term credit from domestic banks and institutional investors. Additional risks include weak enforcement of government commitments and payment delays by state-owned utilities (off-taker risk), the limited availability or high cost of risk mitigation instruments (such as political risk insurance or guarantees), high transaction costs for relatively small-scale projects, and a persistent gap in early-stage project development financing.
Chief among the factors elevating WACC for these projects, however, is currency volatility. Most energy projects in Africa are financed in hard currency (typically dollars or euros) but generate revenues in local currencies, which are often unstable and prone to depreciation. This currency mismatch exposes investors and lenders to significant exchange rate risk, further raising the cost of capital for African projects. This mismatch adds 5-6 percentage points to the cost of capital and results in:
- Increased debt distress: In 2023, Nigeria’s Naira lost 50% of its value against the USD, crippling debtors (often state-owned utilities) who earn revenue in local currency. Ghana’s Cedi depreciated by 20% annually from 2020–2023, compelling the government to absorb approximately $500 million in foreign exchange losses for energy projects.
- Inflated cost of electricity generation: In 2023, the levelized cost of electricity (LCOE) for utility-scale solar in Africa reached 10–15¢/kWh—two to three times higher than in Europe or Asia. This stems primarily from elevated financing costs rather than poor solar resources or high equipment costs.
- Strained government budgets: In Ghana, the government covered energy sector shortfalls equivalent to about 2% of GDP in 2023. In Senegal, energy subsidies reached 3.3% of GDP in 2023 including 1.5% for the power sector.
- Decreased foreign investment: Even with hard-currency-denominated power procurement agreements (PPAs) and sovereign guarantees, currency volatility raises lenders’ risk perception, deterring foreign investment in energy projects.
Local currency financing offers a solution for reducing cost
Local currency financing offers a powerful first step toward solving the high WACC of African energy projects. Using both field evidence and modeling, we quantify the cost reduction benefit of this approach—providing concrete numbers where previous discussions only offered general suggestions
Local currency financing in action—evidence from three African markets
South Africa, Kenya, and Nigeria demonstrate how local currency financing, complemented by policy and risk mitigation tools, can reduce tariffs, increase investment, and mitigate hard currency risk for energy projects. (See additional details in Appendix 1)
- South Africa: Procurement policy reforms increased local financing and reduced tariffs. In 2011, South Africa launched the Renewable Energy Independent Power Producer Procurement Programme (REIPPPP), which provided a transparent and competitive auction framework, standardized and bankable PPAs, and implementation agreements with Eskom to backstop contractual risk. These elements reduced lender uncertainty and enabled local banks to finance up to 70 percent of project debt in South African Rand (ZAR). Pension and insurance funds followed, investing in equity and supporting sovereign green bonds. This policy-driven model helped reduce solar tariffs by more than two-thirds between 2011 and 2023.
- Kenya: Changes in local lending policy drove increased energy infrastructure investment. In 2021, the Retirement Benefits Authority (RBA) increased the allowable ceiling for pension fund investment in infrastructure from 5 to 10 percent. This change enabled the formation of the Kenya Pension Funds Investment Consortium (KEPFIC), which committed over KES 25 billion (USD 229 million) to infrastructure projects between 2021 and 2026. In 2023, KEPFIC received investment interest from energy infrastructure projects seeking KES 100 billion (≈ USD 770 million).
- Nigeria: Local currency risk hedging mechanisms have increased local investment in energy projects. The government supported the creation of InfraCredit in 2017, partnering with the Nigerian Sovereign Investment Authority and GuarantCo. InfraCredit issues guarantees for infrastructure bonds in Nigerian Naira, reducing currency risk and attracting local investors. So far, InfraCredit has mobilized over NGN 159 billion (USD 206 million) from more than 19 pension funds, supporting projects such as North South Power’s 15-year green bond and Darway Coast’s mini-grid portfolio. By anchoring InfraCredit’s capital and engaging regulators, the government has enabled long-term local funding for infrastructure projects, including smaller ones previously considered unbankable.
Quantifying local currency financing benefits with modeling
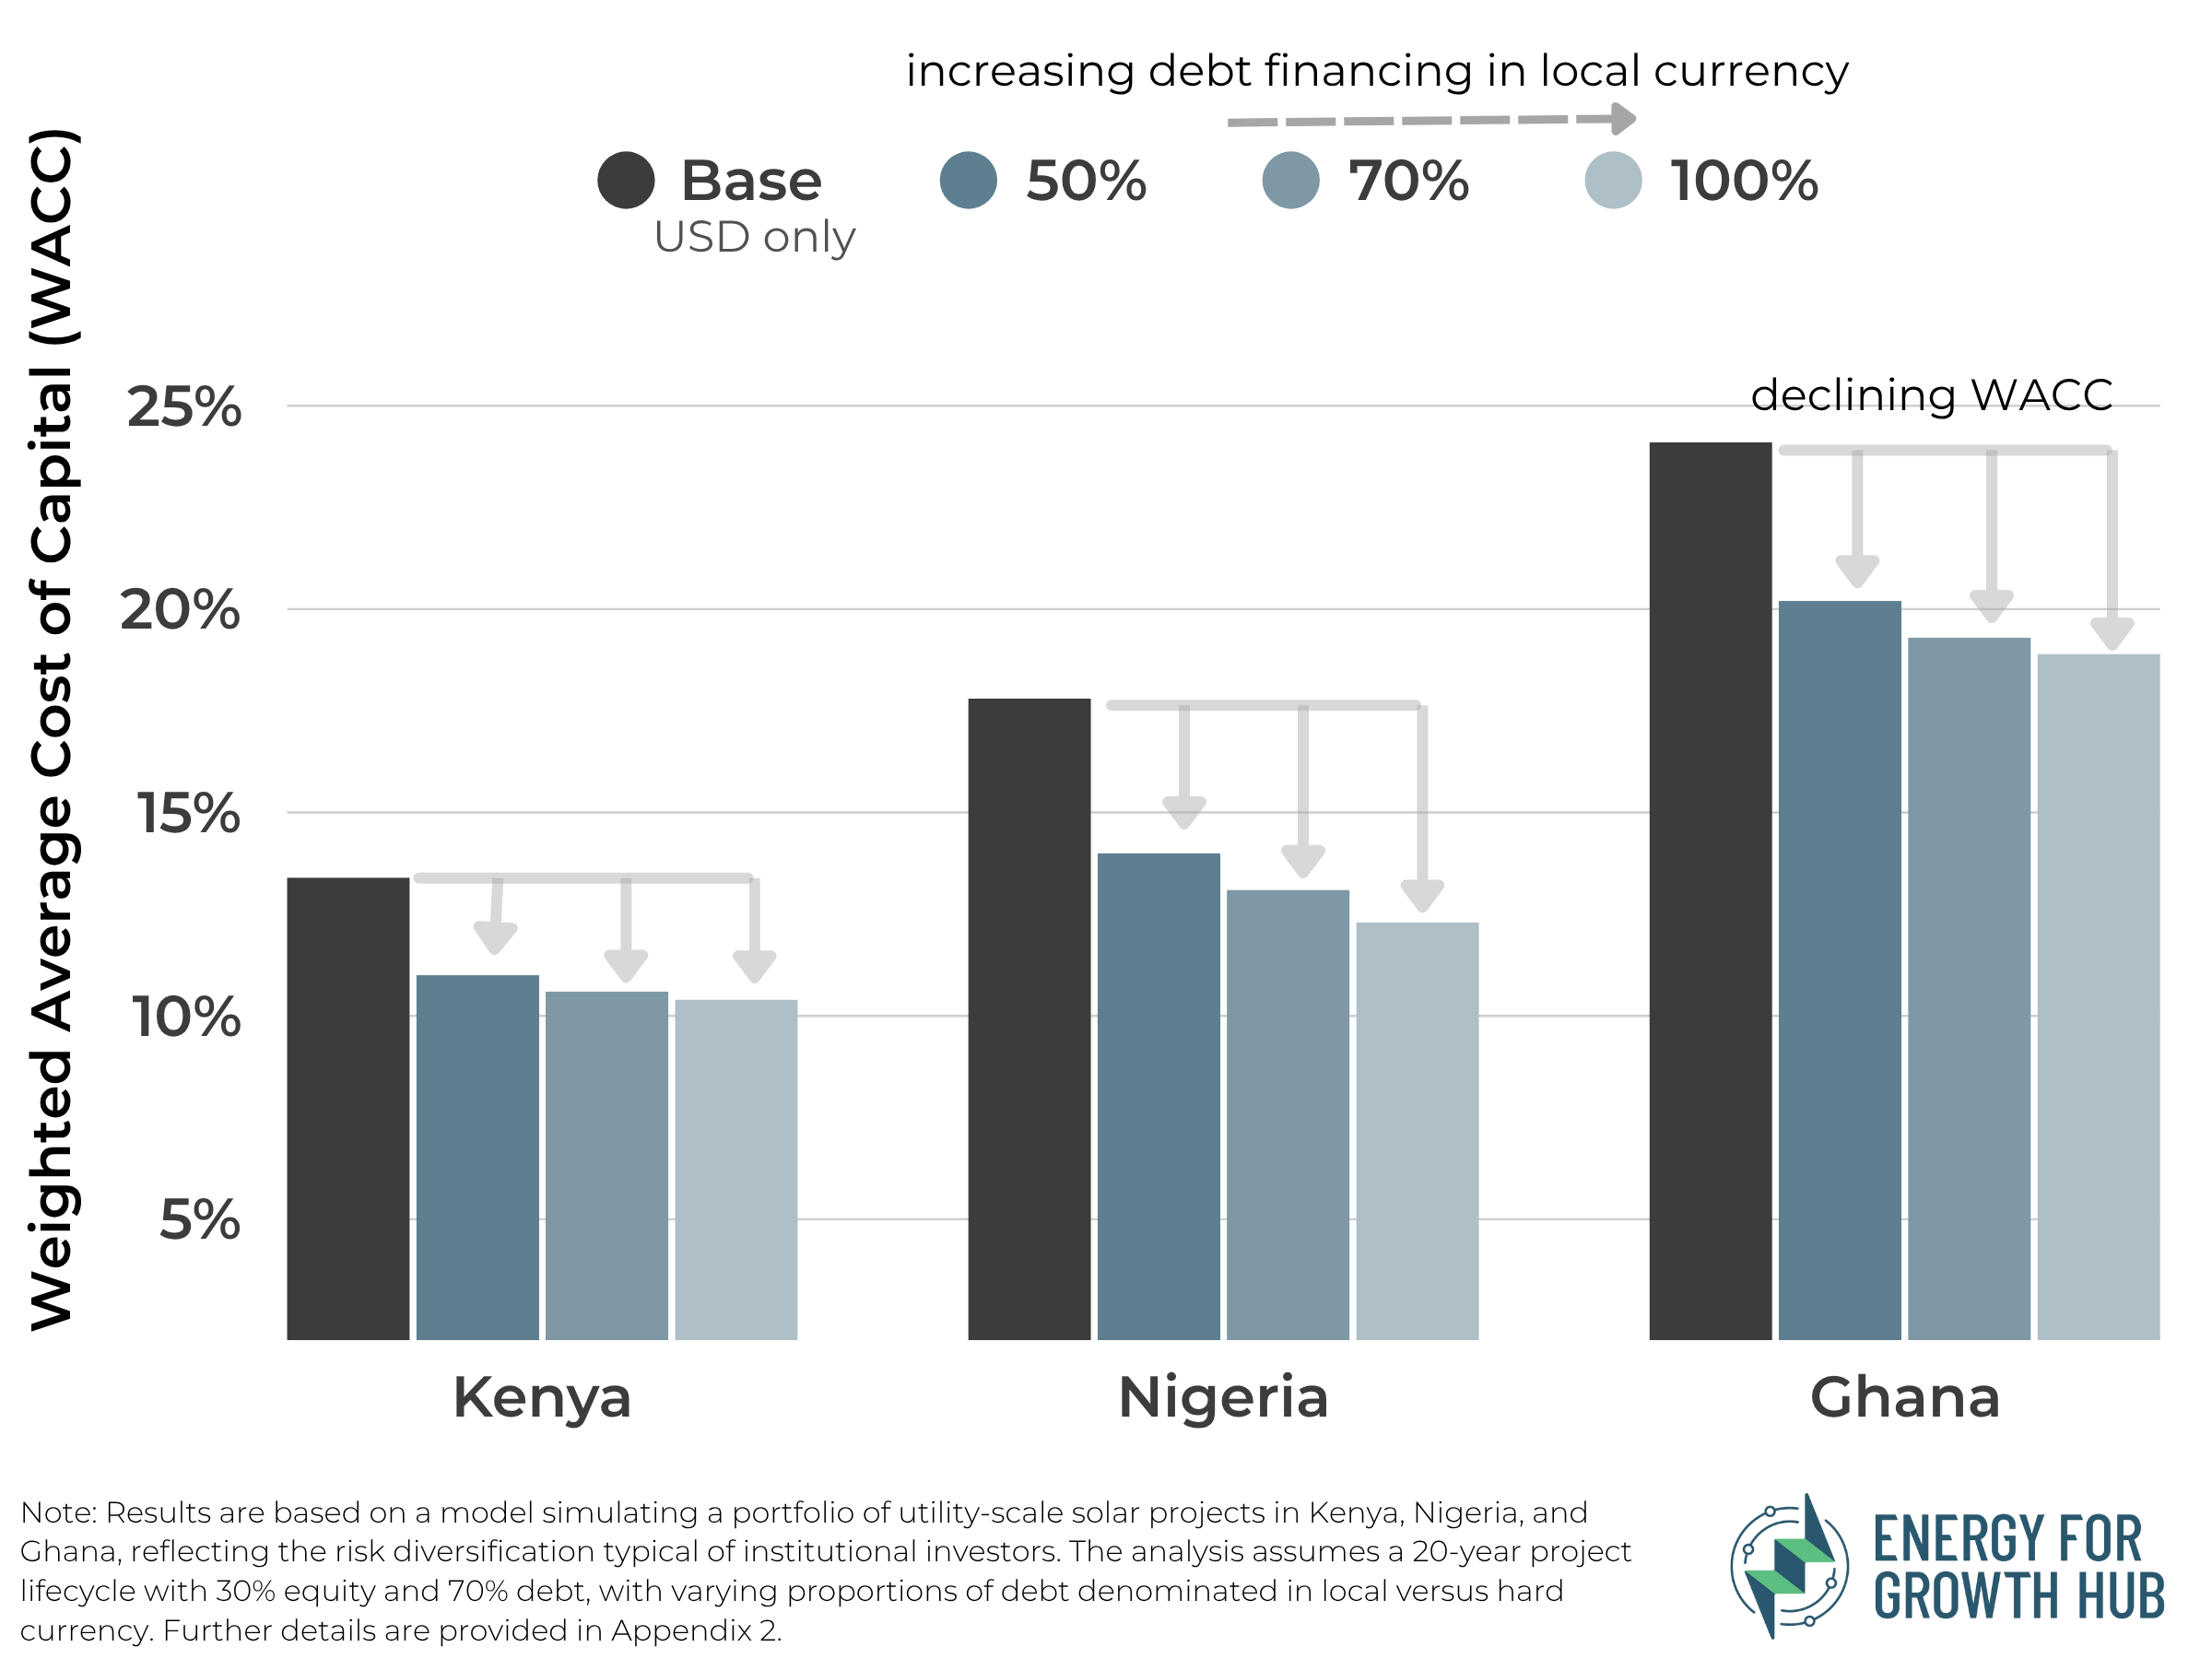
To evaluate whether the impact of local currency financing extends across different markets, we developed a model simulating a portfolio of 500 MW utility-scale solar projects in Kenya, Nigeria, and Ghana reflecting the risk diversification typical of institutional investors. The model analyzes WACC and LCOE over a typical 20-year project lifecycle and compares the baseline scenario in 100% USD financing to mixed debt structures that allow for 50%, 70%, and 100% local currency financing. Appendix 2 outlines details of the model.
Results show that even partial local financing (70%) can capture most of the benefits of full local currency financing while maintaining some USD liquidity. Across all three countries, local currency financing reduces WACC by 3-6 percentage points (21%–31%) and LCOE by 1.4-3.3 cents/kWh (20% to 29%) compared to USD-only financing. Savings from these reductions can range from 13 % (about $14 million/year) to 29% (up to $ 33 million/year) compared to USD-only financing.
FIGURE 1: Cost of Capital for a Portfolio of 500 MW Utility-Scale Solar Projects Under Different Local Currency Financing Scenarios
Key Finding: Successful local financing requires policy support and risk mitigation
Real-world experience shows that local currency financing, while essential, is not sufficient on its own —it must be supported by enabling policy reforms and risk-hedging mechanisms. Our modeling results reflect similar takeaways. In the modeled scenarios for Kenya and Nigeria, inflation and currency devaluation shocks increased LCOE by 3-7% compared to base case. Targeted risk guarantee tools helped offset currency volatility risks and deliver savings over USD-only financing.
FIGURE 2: Cost of Capital for a Portfolio of 500 MW Utility-Scale Solar Projects Financed 100% in Local Currency
Conclusion
Our analysis provides the precise quantification of local currency financing benefits for African energy projects. The evidence is clear: local currency financing, complemented with policy support, can lower capital costs by up to 31% and electricity costs by up to 29% while unlocking investment in African energy projects. Yet most foreign investors will continue to prefer hard-currency instruments. This preference is due to shallow local financial markets, expensive de-risking mechanisms, and policy environments that are often unpredictable or misaligned. Overcoming these structural barriers and expanding local currency financing will require additional policy interventions, an issue we intend to explore in detail in a forthcoming memo.
Endnotes
- IEA (2023). Financing Clean Energy in Africa.
- IRENA (2023). The Cost of Financing for Renewable Power.
- Energy for Growth Hub (2024). Ten Takeaways for Global Energy Poverty from the IEA’s 2024 World Energy Investment Report.
- World Bank (2023). PPA Bankability in Africa.
- BCG (2024). Closing Africa’s Climate Finance Gap
- Clean Air Task Force (2024). Evaluating WACC in African Power Markets.
- Kenya Pension Funds Investment Consortium Deal Book (2023).
- AfDB (2021). Green Bond in South Africa.
- InfraCredit (2023). Annual Report on Nigeria’s Renewable Investments.
- World Resources Institute. (2023). Local Banks Can Unlock Africa’s Clean Energy Future..
- Macroeconomic Indicators for Model: Central Bank reports of each country (2023), IMF forecasts, and IEA references.
- Financing and Cost Benchmarks for Model: IRENA (2023), AfDB (2023), World Bank (2023)