
The Context
In many parts of Nigeria, the reality of electricity reliability is clear: no one has it. This stark truth highlights a widespread problem across sub-Saharan Africa, where electricity grids frequently fail to deliver constant power. This limits the impact of electricity access and forces households and businesses to rely on expensive, polluting alternatives like diesel and gasoline generators.1
However, limited data obscures the full scale and underlying causes of the reliability problem. Without more clarity, efforts to address it risk being ineffective or misdirected. To bridge this knowledge gap, we are conducting a study to identify patterns and drivers of electricity unreliability across Nigeria and provide detailed insights needed to improve it.2,3
Our Methodology
We are gathering outage data spanning 2019 to 2024 from medium voltage level (11kV feeders)4,5 across Nigeria’s 11 electricity distribution companies (DisCos). We are cleaning and analyzing these data using Python, and conducting semi-structured interviews with experts in network operations and energy dispatch teams across the DisCos, the national electricity regulatory authority, and independent energy firms.
This memo examines preliminary data from 37 feeders in a southwestern Nigerian city.6 These feeders supply mostly residential areas, each with over 1,000 customers. Together, they represent about 70% of the city’s 11kV feeders, serving over 260,000 registered customers.
Key Observations
- Outages are significant and worsening: Each feeder experienced an average of 640 outages per year, amounting to roughly 160 days of blackout. This means residents connected to the grid go without power approximately 40% of the time.7 Moreover, reliability appears to be getting worse: the total hours of outages per year increased from an average of 157 days in 2019 to 168 days in 2020.
Why this matters: The data indicates that current efforts to improve reliability are falling short. Policymakers and utilities need targeted tracking and improved strategies to design more effective interventions.
- Reliability varies widely by location and is often driven by financial considerations: Total time in blackout ranges from 30 to 300 days annually across the city (Figure 1). Because the system doesn’t generate enough electricity to meet demand, DisCos ration power.8 While technical factors like feeder capacity play a role, expert interviews reveal that financial considerations — such as customers’ ability and willingness to pay — more often determine where electricity is supplied.
Utilities prioritize delivering electricity to areas where customers are more likely to pay. As one utility expert noted, “Light is not free.”9 This dynamic has been institutionalized under Nigeria’s service-based tariff (SBT) regime, introduced in 2020, which ties higher electricity tariffs to longer hours of supply.10 Consequently, areas with poorer or lower-paying customers experience lower tariffs and fewer supply hours, further deprioritizing these regions and exacerbating inequalities in reliability. Notably, 60% of feeders experienced more outages in 2020 than in 2019, with the most unreliable feeders faring worse (Figure 1).
Why this matters: The findings highlight an urgent need for innovative business models and financing structures to improve affordability, particularly for those already connected to the grid — not just connecting new electricity users, which has been the growing focus within the international development community. Development and philanthropic capital could be strategically deployed to support existing grid-connected users who still face significant reliability challenges. Additionally, the findings emphasize the importance of public awareness campaigns to educate consumers on the cost of electricity and the value of timely payments, which directly impact willingness to pay and, consequently, reliability. Efforts led by policymakers, DisCo managers, development partners, philanthropies, and consumer advocacy groups can help utilities balance financial priorities with equitable electricity distribution.
- Outages are largely unplanned and inconsistent: Nigerians often say, “They have taken the light”, reflecting a perception that outages are deliberate or planned events. However, the data tells a more nuanced story. While planned outages for maintenance and repairs are rare, load shedding — intended to ration power — accounts for about 60% of outages and is rarely executed with precise timing or duration, even under Nigeria’s SBT regime, which simply specifies the expected hours of supply. As one expert described, “Allocation11 comes daily. It can come in, [then] in 2 minutes, it can change again depending on how the generator is currently generating.”
Additionally, over 30% of outages in the city are “forced” outages arising from equipment failure, aging infrastructure, weather conditions, or even vegetation or animals interfering with feeders (Figure 2). As one informant explained, “You cannot predict it; when it will happen…conductor snap, jumper cut, shattered insulator, you cannot predict it…”
Figure 3 illustrates these inconsistencies, showing the frequency of outage start times by hour and day across all analyzed feeders. While there are limited patterns, such as peaks at 5 a.m. and 7 p.m., outages occur throughout the day and week. On average, load-shedding and forced outages last approximately 6 hours, while planned outages for maintenance and repairs last about 4 hours.
Why this matters: Our study, to the best of our knowledge, is the first to distinguish between types of grid-level outages in sub-Saharan Africa. This distinction is critical for crafting the appropriate response: load shedding underscores the need for greater generation capacity, while forced outages call for investments in grid infrastructure, redundancy, and distributed generation. Policymakers, utilities, and development finance institutions can use findings like ours to target investments more effectively, ensuring improved reliability and equity in electricity supply.
Conclusion
The findings above highlight the crucial importance of detailed outage data in developing effective solutions. Our study highlights the untapped potential of existing datasets, which, despite being typically underutilized and minimally analyzed by distribution utilities, offer valuable insights into electricity systems in developing regions.
A concerted effort to catalog, clean, and analyze these resources, combined with innovative data-gathering techniques like big data approaches, can significantly enhance decision-making and improve electricity reliability. Collaboration among utilities, regulators, and researchers is essential to leverage these datasets, unlock actionable insights, and accelerate progress toward more reliable electricity access.
FIGURE 1: Total Duration of Annual Outages Across Core Residential Feeders in the City
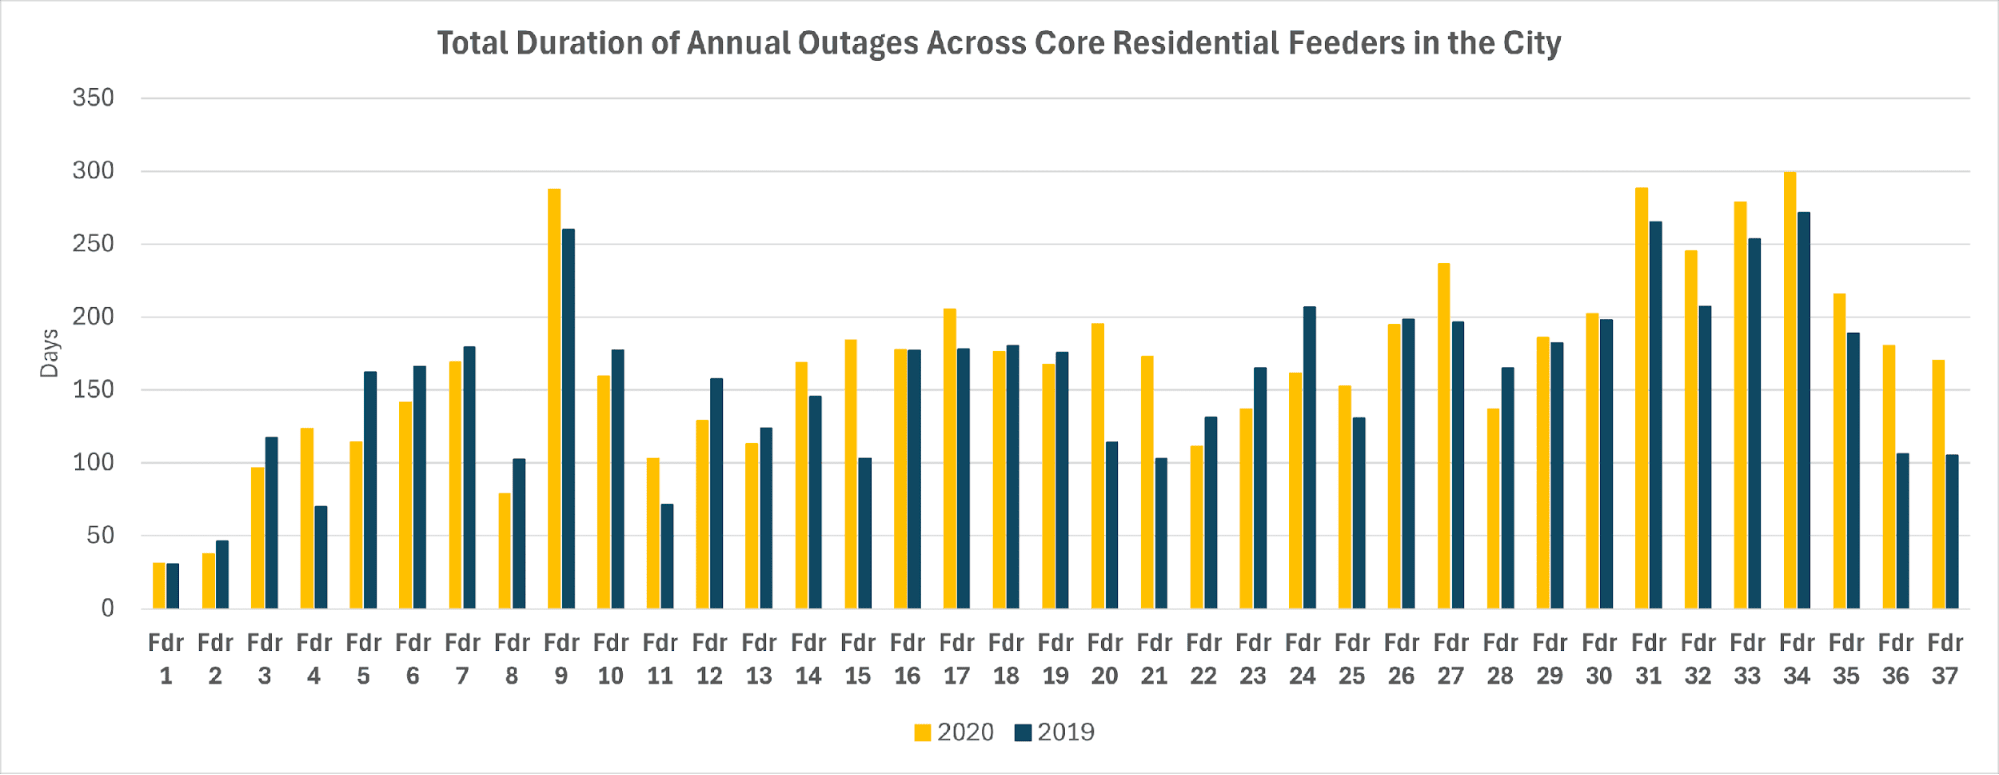
Note: The feeders are arranged in ascending order based on the number of customers they serve.
FIGURE 2: Causes of Grid-level Outages in the City
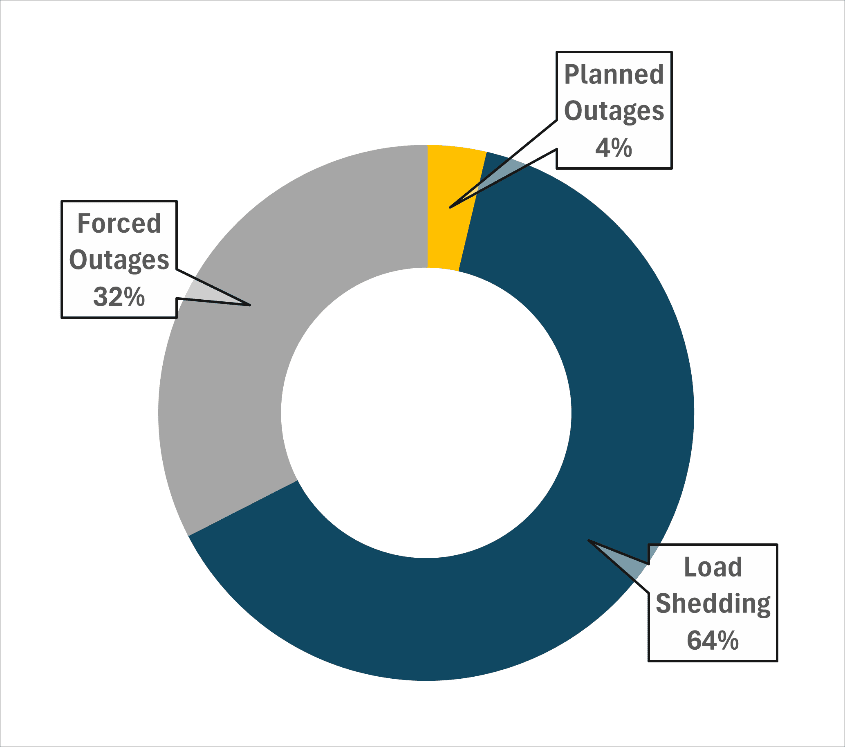
FIGURE 3: Frequency of Outage Start Times by Hour and Day of the Week
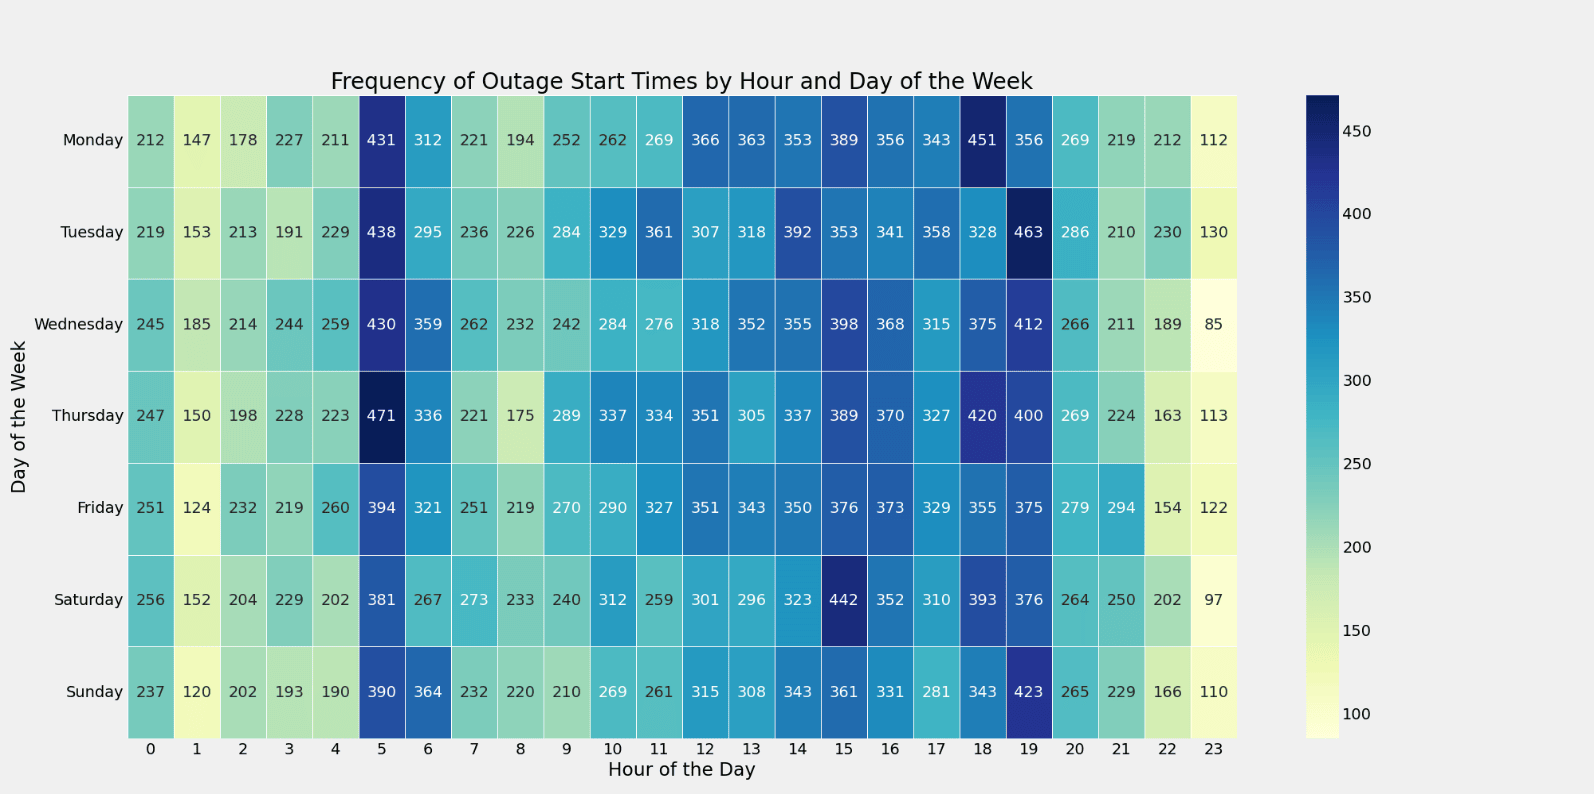
Note: For example, in 2019 and 2020, 212 outages began across the city on a Monday at midnight (between 00:00 and 00:59), while 463 outages started at 7 p.m. (between 19:00 and 19:59) on a Tuesday.
Endnotes
- Farquharson, D., Jaramillo, P., & Samaras, C. (2018). Sustainability implications of electricity outages in sub-Saharan Africa. Nature Sustainability, 1(10), 589-597.
- Nigeria has the highest outage intensity in sub-Saharan Africa and is considered the “world champion” of backup generators. See Mensah, J. T. (2016). Bring back our light: Power outages and industrial performance in sub-saharan Africa; and Heinemann, G., Banzer, F., Dumitrescu, R., Hirschhausen, C. V., Neuhoff, M. E., & Nwadiaru, V. O. (2022). Transforming electricity access by replacing back-up generators with solar systems: Recent trends and evidence from Nigeria. Renewable and Sustainable Energy Reviews, 157, 111751.
- The author is conducting this study as part of her dissertation research in the Energy and Resources Group at the University of California, Berkeley, with advising support from her committee.
- The transmission system in Nigeria comprises 330 kV and 132 kV circuits and substations. Distribution is divided into 11 zones, with distribution networks including 33 kV, 11 kV and low voltage circuits. The 11kV feeders distribute electricity from 33/11kV substations to distribution transformers. Source: Nigeria Electricity System Operator. https://nsong.org/
- Utility-reported values often understate the actual outages within distribution networks, and outages are generally more frequent at the low-voltage level. Consequently, due to flawed incentives or the absence of systematic data collection at the low-voltage, outage records from utilities likely underestimate the unreliability experienced by households. In other words, the quantity of outages reported here, though significant, is most likely an underestimation of the challenges faced by the average household in the region. See Taneja, J. (2018). If you build it, will they consume? Key challenges for universal, reliable, and low-cost electricity delivery in Kenya. Center for Global Development Working Paper, (491).
- The name of the city has been intentionally omitted to preserve the anonymity of the utility involved and to comply with agreed data-sharing and privacy protocols. For context, the State that houses this city had a Gross Domestic Product (GDP) of about 2.5 trillion naira in 2017 (approximately 1.6 billion dollars at December 2024 exchange rates, ~$1 to 1547 naira). The city itself has a population of over 3 million and is one of the five largest cities in Nigeria.
- A 2015 study highlighted that about 70% of the population in the state where this city is located had electricity access. However, specific data on the percentage of the city’s population connected to the grid is not available. Source: Akpan, Uduak. (2015). Technology Options for Increasing Electricity Access in Areas with Low Electricity Access Rate in Nigeria. Socio-Economic Planning Sciences. 51. 10.1016/j.seps.2015.05.001.
- Allocation refers to the amount of electricity distributed to each DisCo, determined by the system operator based on available generation capacity. DisCos submit daily/weekly load estimates, but the approved allocation is often less than requested due to insufficient generation capacity on the grid. These allocations are difficult to enforce because electricity is drawn from the grid spontaneously. To manage discrepancies, the regulator and DisCos periodically reconcile accounts, allocations, and actual usage.
- In Nigeria, electricity is colloquially referred to as “light”.
- Service-Based Tariff (SBT) is a scheme introduced by the Nigerian Electricity Regulatory Commission on the 1st of November 2020 to ensure that electricity tariffs paid by end-users are reflective of the services delivered by electricity distribution companies based on the number of hours of electricity supply per day. Source: Nigeria Electricity Regulatory Commission (NERC) (2023, October 8), Electricity Tariffs. https://nerc.gov.ng/faq/electricity-tariffs/
- Kindly refer to footnote 9.