Project Team: Rose Mutiso, Hamna Tariq, Daniel Johansson, June Lukuyu, Audrey Zenner, Adam Salzman
Project Advisors: Murefu Barasa, Michael Dioha, June Lukuyu, Joel Nana
Africa’s electric vehicle future can’t be built on guesswork
As the global EV transition accelerates, Africa risks being left behind. Mainstream research, including major global EV outlooks, often overlooks the continent entirely or focuses narrowly on a few countries like South Africa. Key drivers of the EV transition in Africa will differ from those in mature markets, requiring tailored policies and infrastructure. Without context-specific data and analysis, African policymakers and investors are flying blind.
In July 2024, we launched a beta version of the first-ever, Africa-wide EV Readiness and Impact Indices to help close this evidence gap. By leveraging public data, smart proxies, and regionally grounded analysis, we sought to demonstrate that while data scarcity presents challenges to advancing Africa’s EV sector, that scarcity is not insurmountable.
Now in 2025, we’re fully launching the platform — with redesigned visuals, new indicator-specific maps, and full public access to the underlying database.
What the index measures
The Africa EV Readiness and Impact Indices provide a data-driven lens into how prepared countries are for an electric mobility transition, and what benefits that transition could unlock.
EV Readiness Index: Assesses the preparedness of 48 African countries to adopt EVs at scale. It draws on ten indicators across five categories: enabling policies, market potential, affordability, grid infrastructure, and power sector maturity, all adapted to the African context.
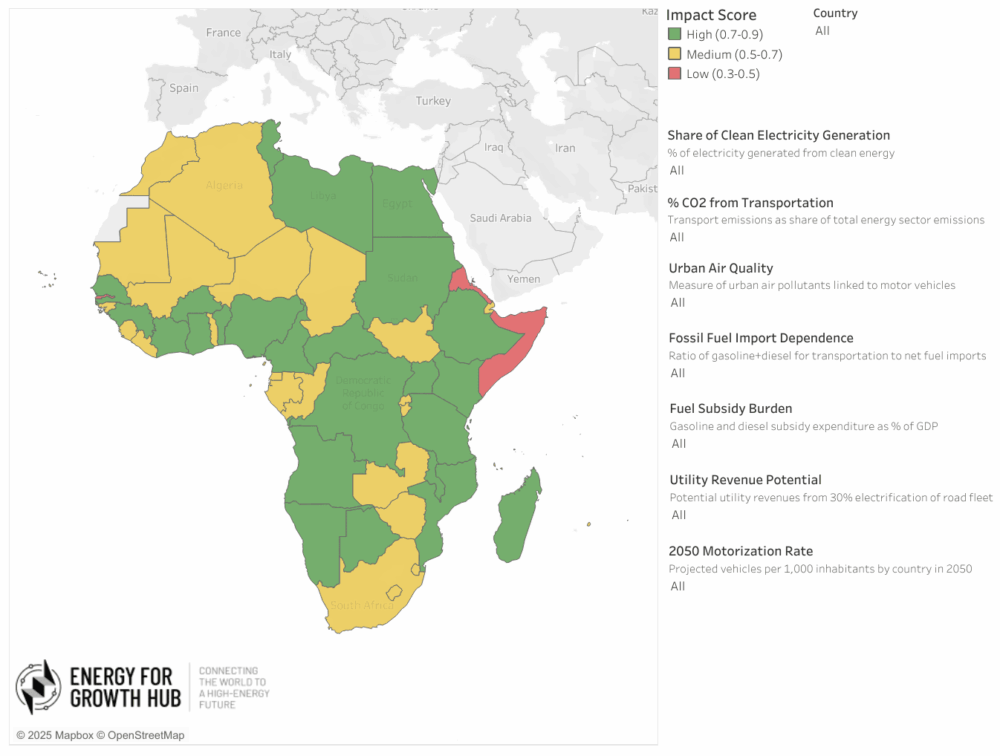
EV Impact Index: Assesses the broader potential benefits of EV adoption in all 54 African countries, covering climate, financial, public health, and cross-cutting impacts. It highlights where EVs could deliver meaningful gains and build momentum for a pro-EV agenda, even in markets still early in readiness.
Each country’s score is built from publicly available data and regionally appropriate benchmarks. Indicators are equally weighted, and countries with limited data were either excluded or evaluated using strict inclusion criteria to maintain analytical integrity. Full methodology available here.
What’s new in the 2025 launch
Access the full data set: Download all underlying data for your own research and analysis, available here.
Explore redesigned maps: Dive into interactive, indicator-level visuals to compare countries across specific readiness and impact factors. (See maps below)
Integrated expert feedback: We incorporated expert feedback from African EV stakeholders to improve relevance, data quality, and usability.
New synthesis of key insights: This launch includes a new piece that distills what we’ve learned since the beta release — including key findings from the index, deep-dive research into specific themes, and insights from stakeholder discussions across the continent.
Readiness Map: Preparedness to adopt EVs at scale
Impact Map: Broader benefits of EV adoption
For optimal map viewing on mobile, please rotate your device to landscape mode.
Footnotes
Visualization: Created using Tableau Desktop Public Edition, version 2024.1.2.
Methodology: Full project methodologies are available here.
Excluded countries: 6 countries are excluded from the EV Readiness Index due to data limitations (Djibouti, Equatorial Guinea, Eritrea, Libya, Somalia, and South Sudan) and are shaded gray. The EV Impact Index covers all 54 African countries.
How to use this map: A few pointers on how to navigate the EV Readiness and EV Impact maps on this page.
Hover over a specific country to see its indicator-level data. On the main readiness and impact pages (first tab), you should be able to see all indicator-level data. The color of the country reflects its total readiness and impact scores.
When you select a specific indicator to display on the main combined maps, the color of the map reflects the overall readiness or impact score, not the score of the indicator you have selected.
For the full launch, we’ve created maps for each readiness and impact indicator. Click on the tabs to select a specific indicator map. Hover over a country to see where it ranks for that specific indicator. The color of the map depends on how the country ranks for the selected indicator.
A blank map means that there is no data in the category you have selected for the specific indicator.
Please select the home button on the top left corner to take the map back to its original form.
When exploring individual indicators, please note that countries missing data for a specific indicator will be displayed with countries in the “low” category for that indicator.
Grid reliability data for Algeria, Angola, Cabo Verde, Eswatini, Gabon, and Libya use SAIDI values instead of the standard outage hours from World Bank surveys. See the methodology document for details.
Acknowledgements: We would like to acknowledge Jake Kincer (former project team member), and Ben Hinchliffe (former project intern) for their invaluable contributions to this project.
Questions: To submit questions or edits to this data, please contact info@energyforgrowth.org.
Six years ago, my colleagues and I published an article in the World Economic Forum asking if Africa was ready for the electric vehicle (EV) revolution.