Planning efficient, least-cost electricity infrastructure can benefit from using modern tools to gather improved information describing areas of interest. Building location data in the form of latitude and longitude coordinates are important when outlining the most efficient ways to electrify an area with limited resources. Comprehensive and accurate building location data is imperative regardless of whether planners are employing manual or automated (i.e. computer model-based) planning methods.
Unfortunately, this data is not always available free of cost, and the data desert is especially bad in areas that need it most. In the below sections, we walk through options to access free and readily available data sets, perform manual image labeling, use machine learning (ML) systems, and purchase building locations data.
The best things in life are free (and readily available).
If you’re looking for building locations data for a specific region, first check to see if it’s freely available. Your data may even exist publicly!
- Building shapes may be available on OpenStreetMap (OSM).1 OSM is a crowdsourced and open repository of buildings, roads, parks, and other geographic features of interest. In low-access regions, building shapes are often only comprehensively available for urban areas, but it is continuously expanding.
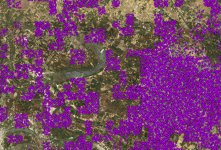
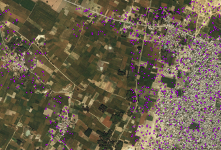
- Machine learning and satellite image-derived population density maps are available through Facebook and Columbia University.2 The Connectivity Lab at Facebook and the Center for International Earth Science Information Network at Columbia University collaborated to provide 30 m grid cell-level population density estimates for the African continent and select areas of Central America, South America and South Asia. While these population density estimates are widely available, using them requires post-processing and may result in less-precise building locations data sets; deriving individual building locations requires scripts for disaggregating building counts from grid cells and produces only coarse location representations, as shown in Fig. 1.
- Even if data is not publicly available, governments may have it privately. We’ve encountered a few cases like this for different countries and regions in sub-Saharan Africa. It doesn’t hurt to ask!
Picky and frugal? Do-it-yourself!
If your desired buildings data is not available on OSM and you need more precise representations than what Facebook and Columbia University provide, you can always build your dataset yourself. There are two main approaches: manual and automatic.
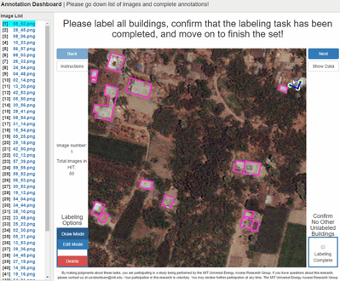
- Manual surveying and labeling is accurate but time-intensive. Performing field-based surveys using GPS devices is usually done concurrent with other door-to-door surveying efforts using smartphone and tablet-compatible applications like OpenDataKit.3 If only building locations data is desired, annotators can instead take advantage of different satellite image sources to speed things up. Point- and shape-based manual satellite image labeling can be performed using tools like Google Earth, QGIS, ArcGIS, and the DrawMe web tool.4 An example using DrawMe is presented in Fig. 2.
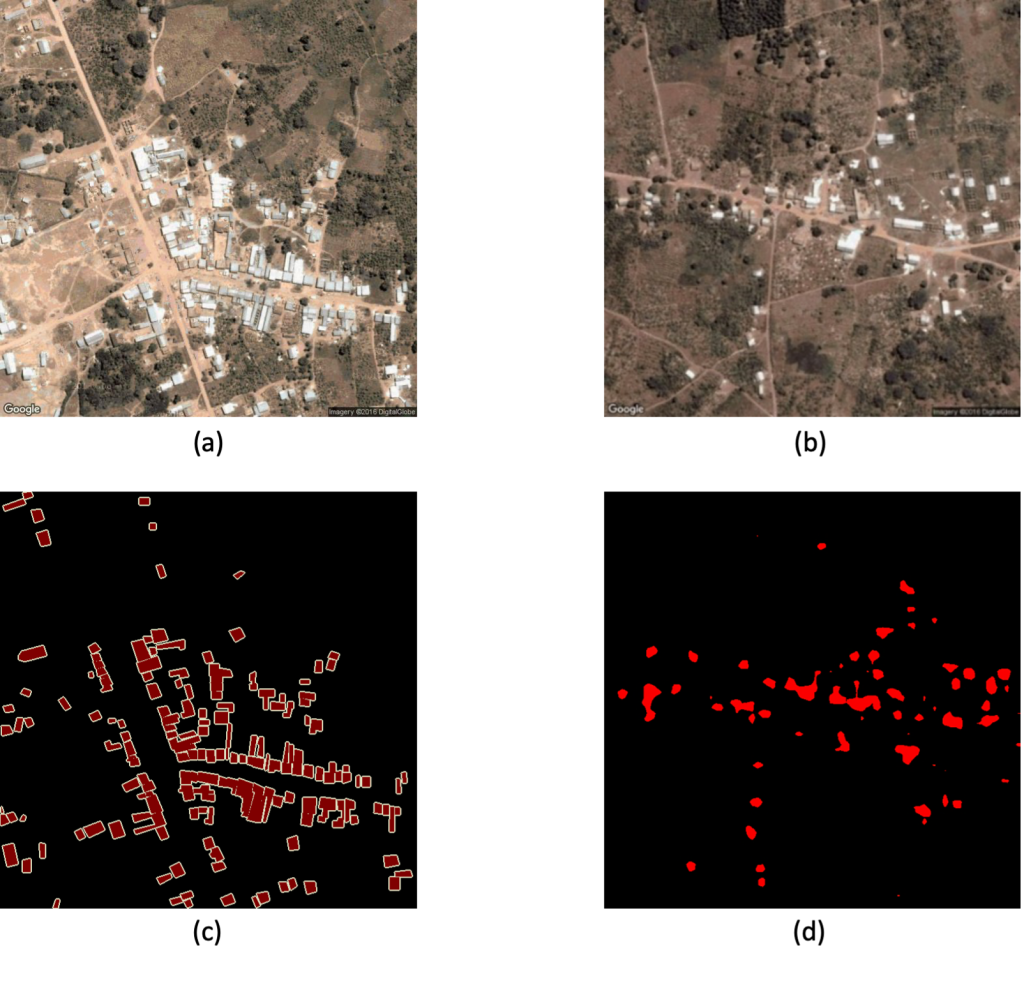
- Machine learning models for ‘semantic segmentation’ can extract building footprints. Semantic segmentation differs from whole-image or bounding-box image classification methods because it entails classification at the individual pixel-level. Though using these ML tools requires technical expertise, the compilation of manually annotated shape-based “training data sets,” beefy computers with graphics cards, and access to high resolution satellite imagery, these models can scale and provide users with full control over automatic building extraction at scale.5 Open-source computer vision models like FCN6 and SegNet7 have been applied to the building extraction problem in low-access contexts.8 High-res imagery may come from ESRI, Google Maps, Google Earth Engine, Mapbox, or directly from vendors like Maxar, Planet, and Satellogic.
- ‘Weakly supervised’ machine learning approaches reduce training data requirements but also reduce accuracy. Procuring training data for the semantic segmentation requires outlining each individual building within tens or hundreds of images. If there is high image variability in terms of satellite attributes or building appearance, even more training data is necessary. To decrease costs related to training data procurement, researchers have developed building extraction systems using weakly supervised learning approaches.9 In this context, these ML systems only require binary labels: “yes, there is at least one building in this image” or “no, there are no buildings in this image.” Such binary labeling at the image-level, as shown using the LabelMe web interface10 in Fig. 4, is significantly faster than labeling individual building shapes. Because training data for weakly supervised approaches contain less information than for semantic segmentation approaches, accuracy metrics from weakly supervised models are lower on average.
Deep pockets? Buying building location data at scale.
Another route is to simply outsource building extraction to specialized companies.
- You can hire a company to perform field surveys or manually annotate satellite imagery for you; for these activities, Development Maps will charge $0.50-2.00/building or $0.10-0.20/building, respectively.11 It is likely that other commissioning options are available depending on your local context.
- AI companies will handle satellite image acquisition, training data compilation, and machine learning. Ecopia Tech Corporation,12 Orbital Insight,13 and Planet Labs Inc.14 all offer solutions for automatic building extraction at scale.
TABLE 1: Menu of building location data options as of December 2020
| TABLE 1: Menu of building location data options as of December 2020 | ||||||||
|---|---|---|---|---|---|---|---|---|
| # | DESCRIPTION | AUTOMATIC OR MANUAL | BLDG. POINT OR SHAPE | ACCURACY LEVEL | EFFORT LEVEL (1 to 10, LOW TO HIGH) | WHAT DO WE NEED TO DO IN-HOUSE? | COSTS TO OUT-SOURCE | COMMENTS AND SOURCES |
| 1 | Using public buildings data | Both | Shape | High | 1 | Nothing | None | Less available in low-access regions; OpenStreetMap |
| 2 | Disaggregating Facebook/HRSL | Automatic | Point | Low | 1 | Sample buildings from grid cells | None | Facebook, HDX; Columbia University |
| 3 | Manual field-based survey | Manual | Point | Very high | 10 | Perform field surveys | $0.50-2.00/ bldg15 | Development Maps; Could entail OpenDataKit |
| 4 | Manual image labeling, point | Manual | Point | High | 7 | Annotate satellite imagery | $0.10-0.20/bldg15 | Development Maps; Could entail Google Earth, QGIS, ArcGIS |
| 5 | Manual image labeling, shape | Manual | Shape | High | 8 | Annotate satellite imagery | Unknown | Could entail DrawMe |
| 6 | Machine learning: semantic segmentation | Automatic | Shape | High | 4 | Procure satellite imagery; run semantic segmentation | Varies | Requires shape annotations at individual building rooftop-level; Run semantic segmentation algorithm like FCN or SegNet; Can purchase from: Ecopia Tech Corp., Orbital Insight, Planet Analytics |
| 7 | Machine learning, weakly supervised classification | Automatic | Point | Low | 3 | Procure satellite imagery; run weakly supervised classification | Unknown | Requires binary labels at satellite-image level, e.g. via LabelMe; Run algorithm like Grad-CAM or LT-WAN |
FIGURE 1: ‘Poisson-disc sampling,’ which disaggregates grid cell-level data, can be applied to Facebook and Columbia University’s population density maps and leads to coarse representations of building locations.


FIGURE 2: Annotators can use the DrawMe web tool to quickly define building shapes in satellite imagery.

FIGURE 3: Machine learning models for semantic segmentation take satellite images (a) and corresponding shape-based training data (c) as input, and when given a never-before-seen image (b), it can automatically extract building footprints (d).

Endnotes
- This section corresponds to row number 1 in Table 1; OSM link: https://www.openstreetmap.org/ .
- This section corresponds to row number 2 in Table 1; relevant links: https://data.humdata.org/organization/facebook?vocab_Topics=baseline%20population , https://www.ciesin.columbia.edu/data/hrsl .
- This method corresponds to line 3 in Table 1; ODK reference: Hartung, C., Lerer, A., Anokwa, Y., Tseng, C., Brunette, W. and Borriello, G., 2010. Open data kit: tools to build information services for developing regions. In Proceedings of the 4th ACM/IEEE International Conference on Information and Communication Technologies and Development (pp. 1-12).
- These methods correspond to lines 4 and 5 in Table 1; DrawMe reference: Xiao, J., Hays, J., Ehinger, K.A., Oliva, A. and Torralba, A., 2010, June. Sun database: Large-scale scene recognition from abbey to zoo. In 2010 IEEE Computer Society Conference on Computer Vision and Pattern Recognition (pp. 3485-3492). IEEE.
- This method corresponds to line 6 in Table 1.
- Long, J., Shelhamer, E. and Darrell, T., 2015. Fully convolutional networks for semantic segmentation. In Proceedings of the IEEE Conference on Computer Vision and Pattern Recognition (pp. 3431-3440).
- Badrinarayanan, V., Kendall, A. and Cipolla, R., 2017. Segnet: A deep convolutional encoder-decoder architecture for image segmentation. IEEE Transactions on Pattern Analysis and Machine Intelligence, 39(12), pp.2481-2495.
- Lee, S.J., 2018. Adaptive electricity access planning, Massachusetts Institute of Technology.
- This method corresponds to line 7 in Table 1. One example is LT-WAN: Iqbal, J. and Ali, M., 2020. Weakly-supervised domain adaptation for built-up region segmentation in aerial and satellite imagery. ISPRS Journal of Photogrammetry and Remote Sensing, 167, pp.263-275.
- LabelMe: a database and web-based tool for image annotation. B. Russell, A. Torralba, K. Murphy, W. T. Freeman. International Journal of Computer Vision, 2007.
- http://www.developmentmaps.org/.
- https://www.ecopiatech.com/.
- https://orbitalinsight.com/geospatial-technology/object-detection.
- https://www.planet.com/products/analytics/.
- Prices quoted based off of data provider, Development Maps, associated with UK-based Village Infrastructure http://www.developmentmaps.org/.
