


Why it matters: Chronic underinvestment in power infrastructure and persistent institutional challenges, including insufficient cost recovery from customers, have long hampered efforts to make large central grids in sub-Saharan Africa more affordable and reliable. In this context, falling costs of solar PV have enabled distributed solar to emerge as a popular workaround. To fully harness its potential, African governments can draw insights from the experiences of other regions — both successes and cautionary tales — to accelerate distributed solar adoption and maximize its benefits, while being careful not to exacerbate existing inequities or undermine utility finances.
Distributed Solar is Rapidly Expanding in Africa
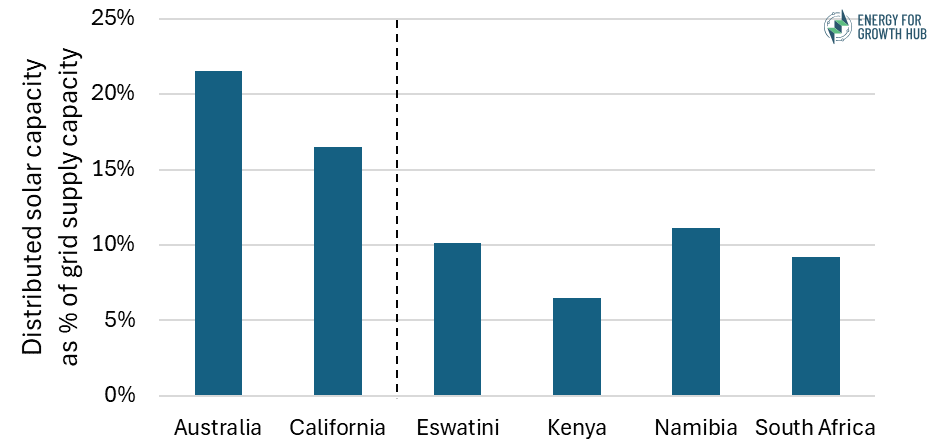
As shown in Figure 1, grid-connected, distributed solar now plays a major role in the electricity supply across several African countries.
- Distributed solar capacity in African markets is significant. While not yet on par with mature market leaders such as Australia and California, countries like South Africa, Namibia, and Eswatini have seen distributed solar grow to ~10% of grid supply capacity [2].
- And it continues to grow rapidly. Current distributed solar capacity in South Africa is estimated to be approximately 5 GW, and growth was more than 250 MW per month in the first quarter of 2024 [3]. Kenya, Eswatini, and Namibia have seen year-on-year growth rates exceeding 40%.
FIGURE 1: Grid-connected, distributed solar capacity as approximate share of grid supply capacity (including import capacity). (See notes: [2])
How African Markets Differ from Mature Ones
In mature markets, adoption has been driven by government subsidies
High shares of grid-connected, distributed solar in mature markets have been achieved primarily through government financial incentives, because:
- Reliable grids reduce the urgency for distributed solar adoption. In the absence of frequent outages, customers in mature markets like California or Australia have little reason to invest in distributed solar for backup power.
- Generous subsidies have been the main driver of adoption. In California, Net Energy Metering (NEM), where billed consumption is offset by solar production, provided significant financial incentives to go solar, particularly for high-consumption consumers who could escape high marginal rates by doing so [4]. In Australia, Feed-In Tariffs, generous payments to solar owners for every kWh produced, accelerated residential solar adoption [5].
However, subsidies have had significant unintended consequences. While they are unsurprisingly effective at driving solar adoption, these government incentives have often been costly and regressive (benefiting wealthier households). They have also distorted markets by steering investment away from lower-cost grid-scale solutions.
In Africa, adoption is driven by the cost and unreliability of grid power
Distributed solar adoption in sub-Saharan Africa is happening organically, without widespread subsidies, because it directly addresses urgent cost and reliability concerns for consumers:
- Commercial customers dealing with frequent load shedding are opting for solar to displace costly diesel (example: South Africa). These customers save money by switching from diesel generators to solar, which has a generation profile that often matches commercial hours.
- Commercial customers are opting for solar over expensive grid power (examples: Eswatini, Kenya, Namibia). Solar cuts costs for these customers by reducing their consumption of costly grid power.
- Residential customers are switching to solar for reliable power supply (example: South Africa). Affluent households invest in solar (generally paired with a battery) to cope with frequent load shedding.
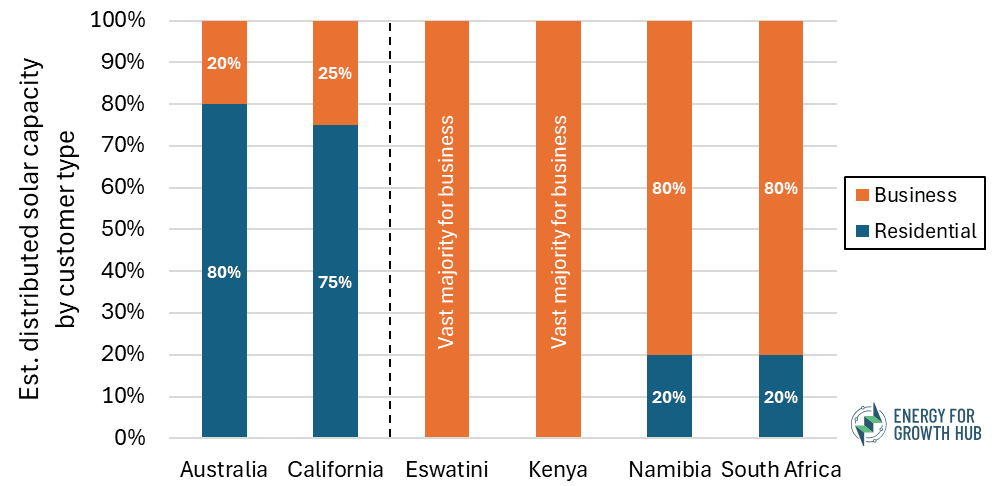
Solar can offer especially strong value propositions for commercial customers, who have the resources to self-finance installations and typically see payback periods as short as 2-5 years. This is consistent with the notably higher share of adoption by businesses compared with residences in sub-Saharan Africa (see Figure 2).
FIGURE 2: Estimated mix of solar capacity by customer segment: residential versus business (including commercial and industrial). (See notes: [6])
Policy Implications
- Recognize the growing significance of distributed solar. Solar is an important workaround to inadequate grids in sub-Saharan Africa, particularly for commercial customers who use solar to displace expensive diesel backup or expensive grid power. Given this value proposition, distributed solar is likely to keep growing in importance even in the continued absence of subsidies.
- Improve coordination without stifling growth. A large share of distributed solar installations in sub-Saharan Africa are not even registered with utilities — as high as 45% in South Africa [7]. This highlights the need for better coordination with utilities to ensure high technical and safety standards, improve grid management, and inform grid expansion requirements. However, governments should be careful to avoid red tape that would actively slow adoption.
- Encourage battery pairing. Batteries, while expensive, can enhance the value of solar to users facing unreliable grids by allowing them to time shift their self-generated energy to periods when grid power is unavailable. If the right systems and incentives are in place, batteries can also provide value to the grid by discharging (i.e., increasing supply) when net demand is high and charging (i.e., increasing demand) when there is an excessive supply of variable renewable energy [8].
- Be cautious with subsidies. Most mature markets are scaling back or redesigning incentives for distributed solar due to their potentially distortionary effects. African governments should learn from these pitfalls, and be especially careful to avoid implementing policies that (1) exacerbate inequalities by favoring affluent customers, and (2) increase the financial vulnerability of power utilities by reducing demand for grid power and increasing the complexity of grid management. More research is needed to assess the possible impacts, both positive and negative, of distributed solar on utilities and consumers in sub-Saharan Africa.
Endnotes
- We define distributed solar here as grid-connected solar on the customer side of the distribution network (i.e., “behind the meter”), as distinct from grid-scale solar farms that are interconnected into the high-voltage transmission network. The vast majority of these distributed solar installations are small-scale (<1 MW) solar PV systems on rooftops, although they could be ground-mounted as well.
- We define “grid supply capacity” as the approximate maximum power that can be delivered via the grid — specifically, nameplate generation capacity plus maximum available import capacity. Data is the latest available for each jurisdiction, from either 2023 or 2024. Data sources: Australia distributed solar capacity in 2023 from National Survey Report of PV Power Applications 2023; Australia grid supply capacity in 2023 from US EIA 2024; California distributed solar capacity in 2023 from US EIA Form EIA-861M; California grid supply capacity in 2023 from CEC 2024 (for installed generation capacity) and CAISO 2024 (for available import capability); Eswatini data as of May 2024 from Eswatini Electricity Company (direct communication with Joel Nana, including for estimated maximum imports from South Africa); Kenya data from EPRA Energy and Petroleum Statistics Report 2024 (from table on p. 10, using captive solar as distributed solar capacity and total installed interconnected capacity as grid supply capacity); Namibia distributed solar capacity as of May 2024 from Electricity Control Board (direct communication with Joel Nana); Namibia grid supply capacity as of 2023 from NamPower Integrated Annual Report 2023 p. 17; South Africa distributed solar capacity from Small-scale Embedded Generation Report 2024; South Africa grid supply capacity from Eskom Integrated Report for the year ended 31 March 2024 p. 9.
- This growth was spurred in significant part by the power crisis in the country from 2019-2023.
- California has since replaced Net Energy Metering with the “Net Billing Tariff” mechanism, which only compensates rooftop solar output at its value to the grid at the time it is generated.
- Xiuyue Deng, Stephen Poletti, Timothy Hazledine, Miaomiao Tao, and Erwann Sbai, “Deploying solar photovoltaic through subsidies: An Australian case,” Journal of Environmental Management 372, 2024.
- Data sources: Australia estimates based on 2023 figures for National Energy Market only from AEMO website; California estimates based on 2023 figures for the three Investor-Owned Utilities (PG&E, SCE, and SDG&E) only from California Distributed Generation Statistics; Eswatini estimates based on data as of August 2024 from Eswatini Electricity Company (direct communication with Joel Nana); Kenya estimates based on June 2024 data from Energy & Petroleum Statistics Report 2024; Namibia estimates based on data from Electricity Control Board as of May 2024 (direct communication with Joel Nana); South Africa estimates based on 2023 data from Small-scale Embedded Generation Report 2024.
- South African Local Government Association, “Status of Embedded Generation in South African Municipalities,” December 2023, https://www.sseg.org.za/wp-content/uploads/2024/02/Status-of-EG-in-South-African-Municipalities-2023-FINAL-2.pdf
- Net demand is customer demand minus variable renewable output.