


Why it matters
Commercial enterprises in many African countries — spanning telecom, retail, agriculture, mining, and manufacturing — rely on off-grid power, primarily diesel generation, to meet their energy needs. These consumers are opting to pay more in fuel expenses, as voltage surges from unreliable grids damage sensitive commercial equipment and outages make predictable operations and productivity difficult to maintain. As commercial customers migrate off-grid, utilities lose their highest-paying revenue base, leaving them unable to fund grid maintenance or service residential loads. Meanwhile, initiatives like the World Bank and the African Development Bank’s Mission 300 aim to connect millions of new consumers, adding serviceable obligations for utilities. Without accounting for this existing underserved demand or recapturing some commercial customers, financially strained African utilities will continue to struggle to provide reliable service once donor funds taper off.
The scale of Africa’s diesel generation capacity is unknown, so we modeled it
While there are several public and proprietary databases that track grid generation assets and capacity, no comparable tracking exists for diesel generation. So, we built an import data-based estimation model predicated on a similar 2022 analysis by Wood Mackenzie. Using more than two decades of diesel generator import data across 51 African countries, we estimate installed diesel generator capacity both at the country and the continent level. Model details are presented in the appendix.
A shadow power system has been growing alongside Africa’s grid
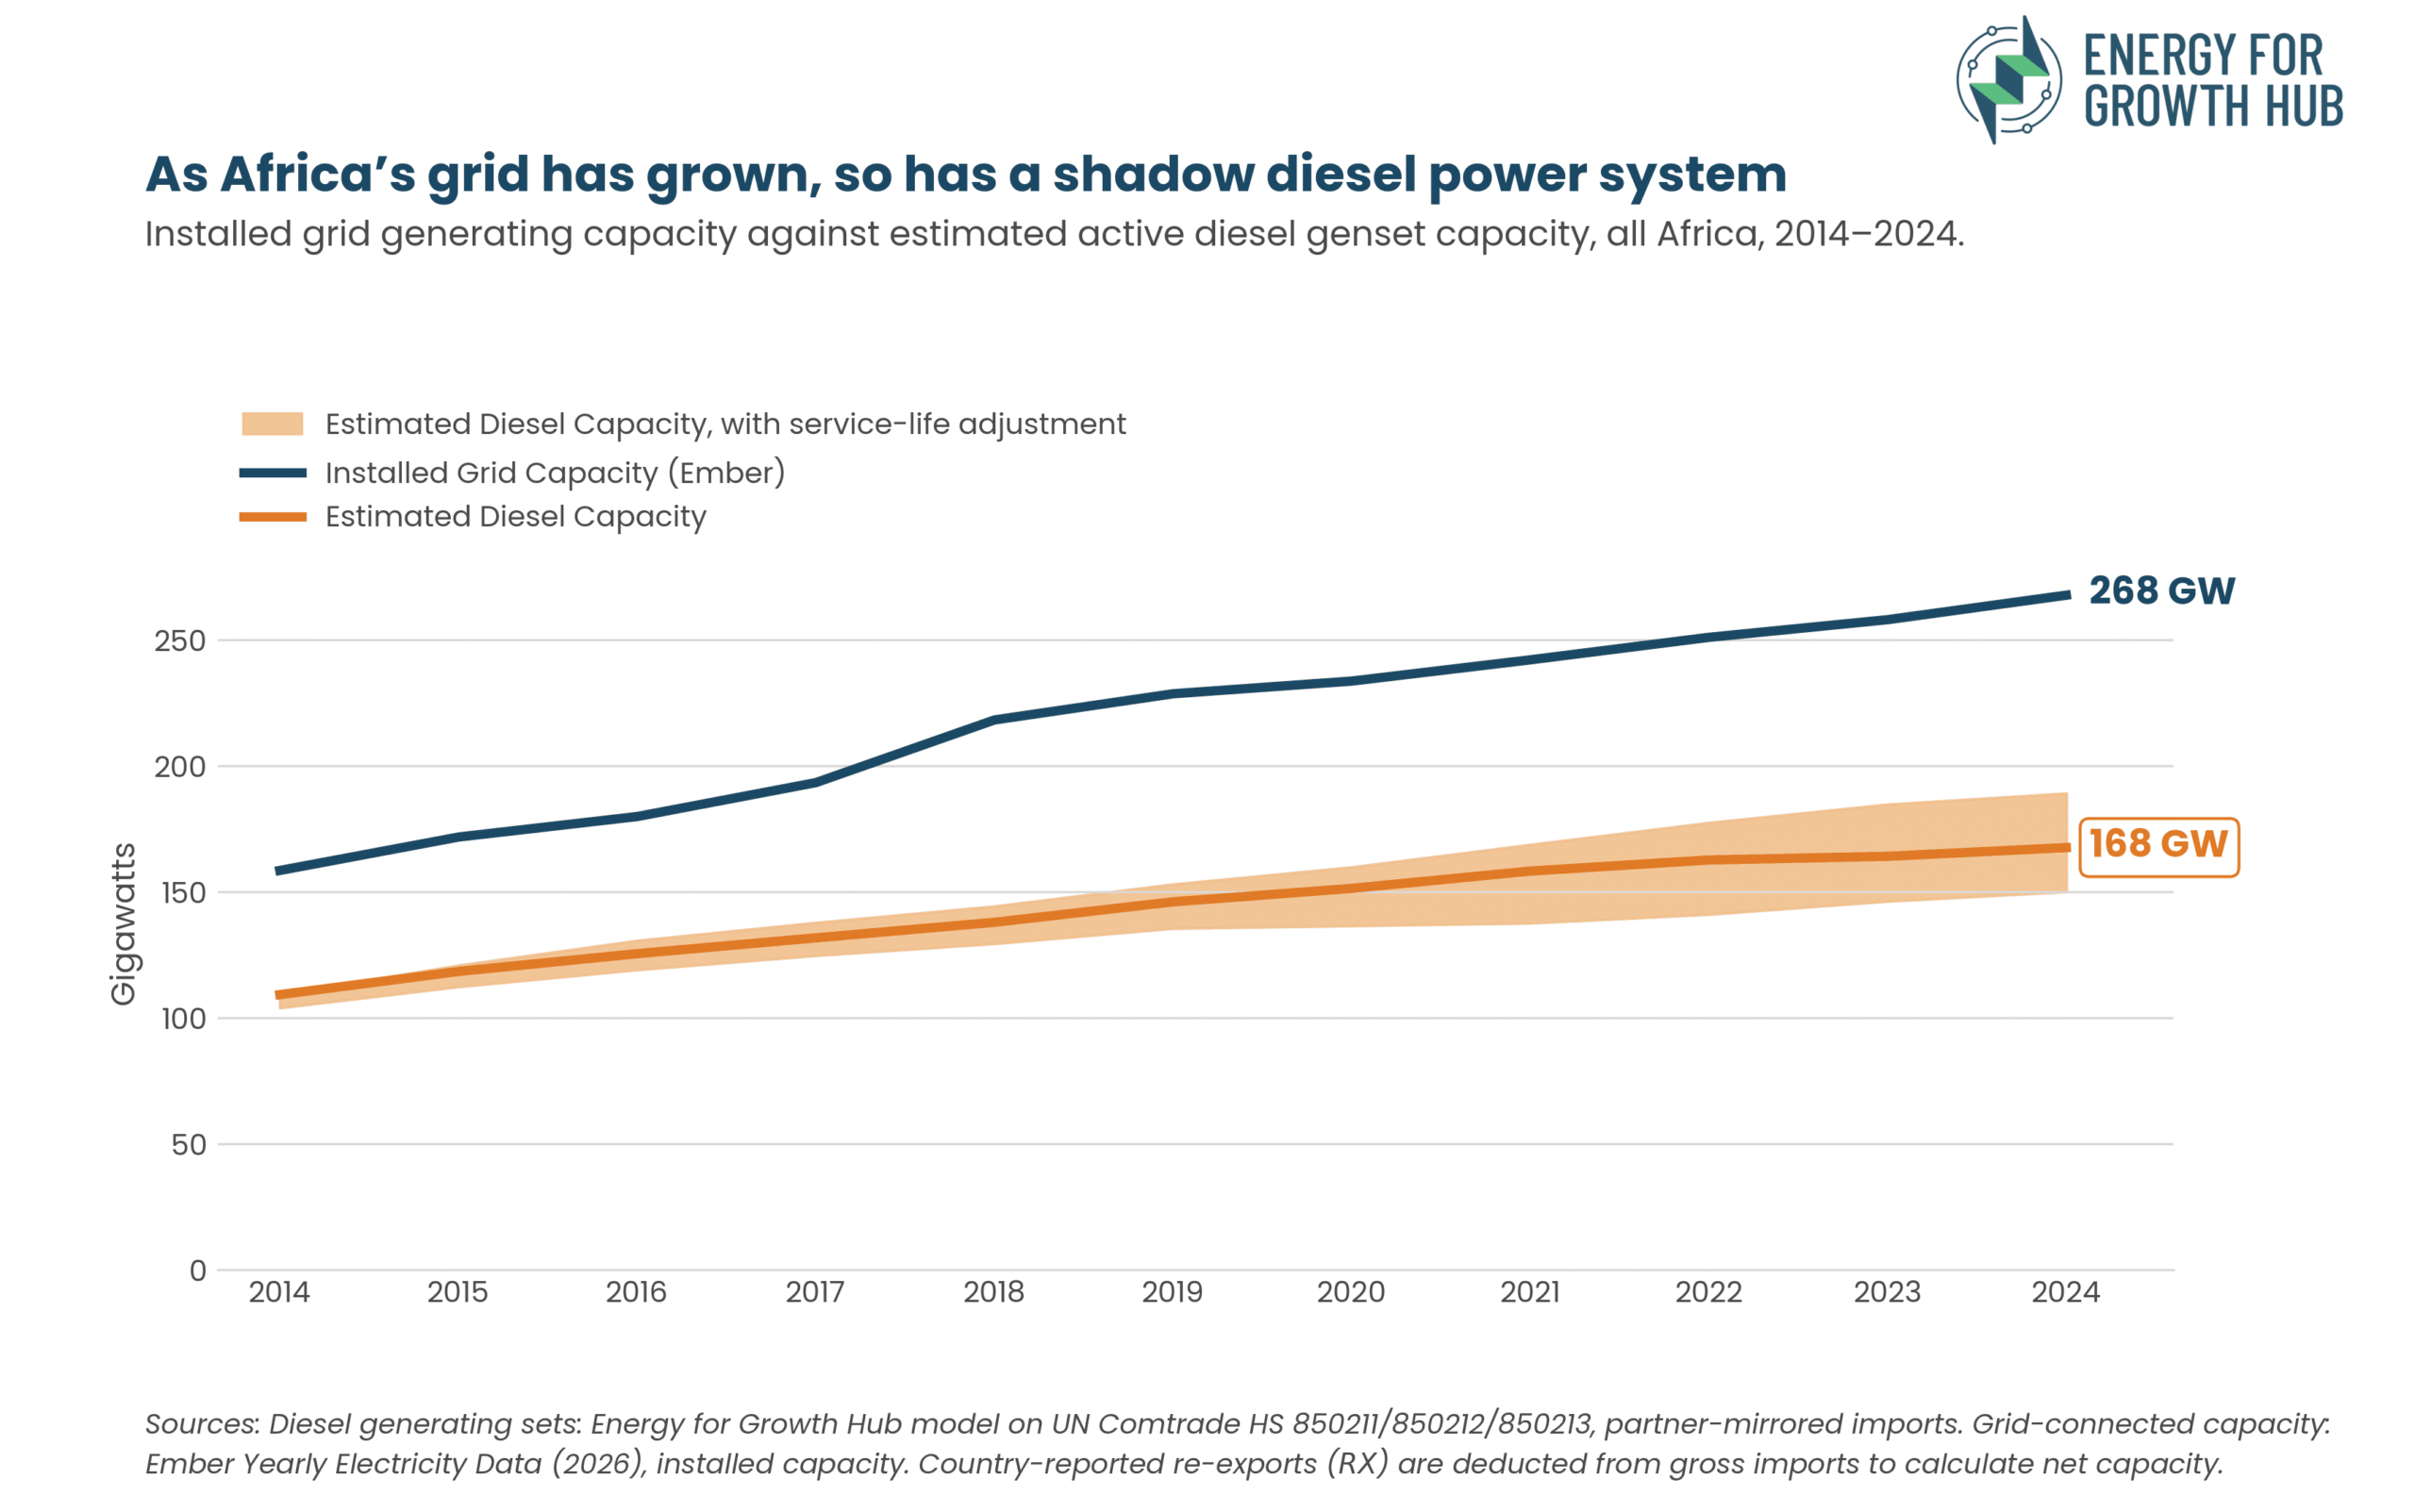
Using our model, we estimate 150 to up to 190 GW of active diesel generating capacity was operated across 50 African markets in 2024, with a central estimate near 170 GW. That represents 63% of Africa’s 268 GW of installed grid-connected generation capacity. This capacity also has been tracking the grid for at least a decade. Between 2010 and 2014, African grids added 136 GW of generation capacity (Ember) and the shadow power system added 105 GW, a 9-14 GW steady annual clip with no downward trend. Operational diesel capacity has held at 63-70% of grid capacity every year recorded since 2014.
Twenty six sub-Saharan economies are functioning more on diesel generators than on grid power
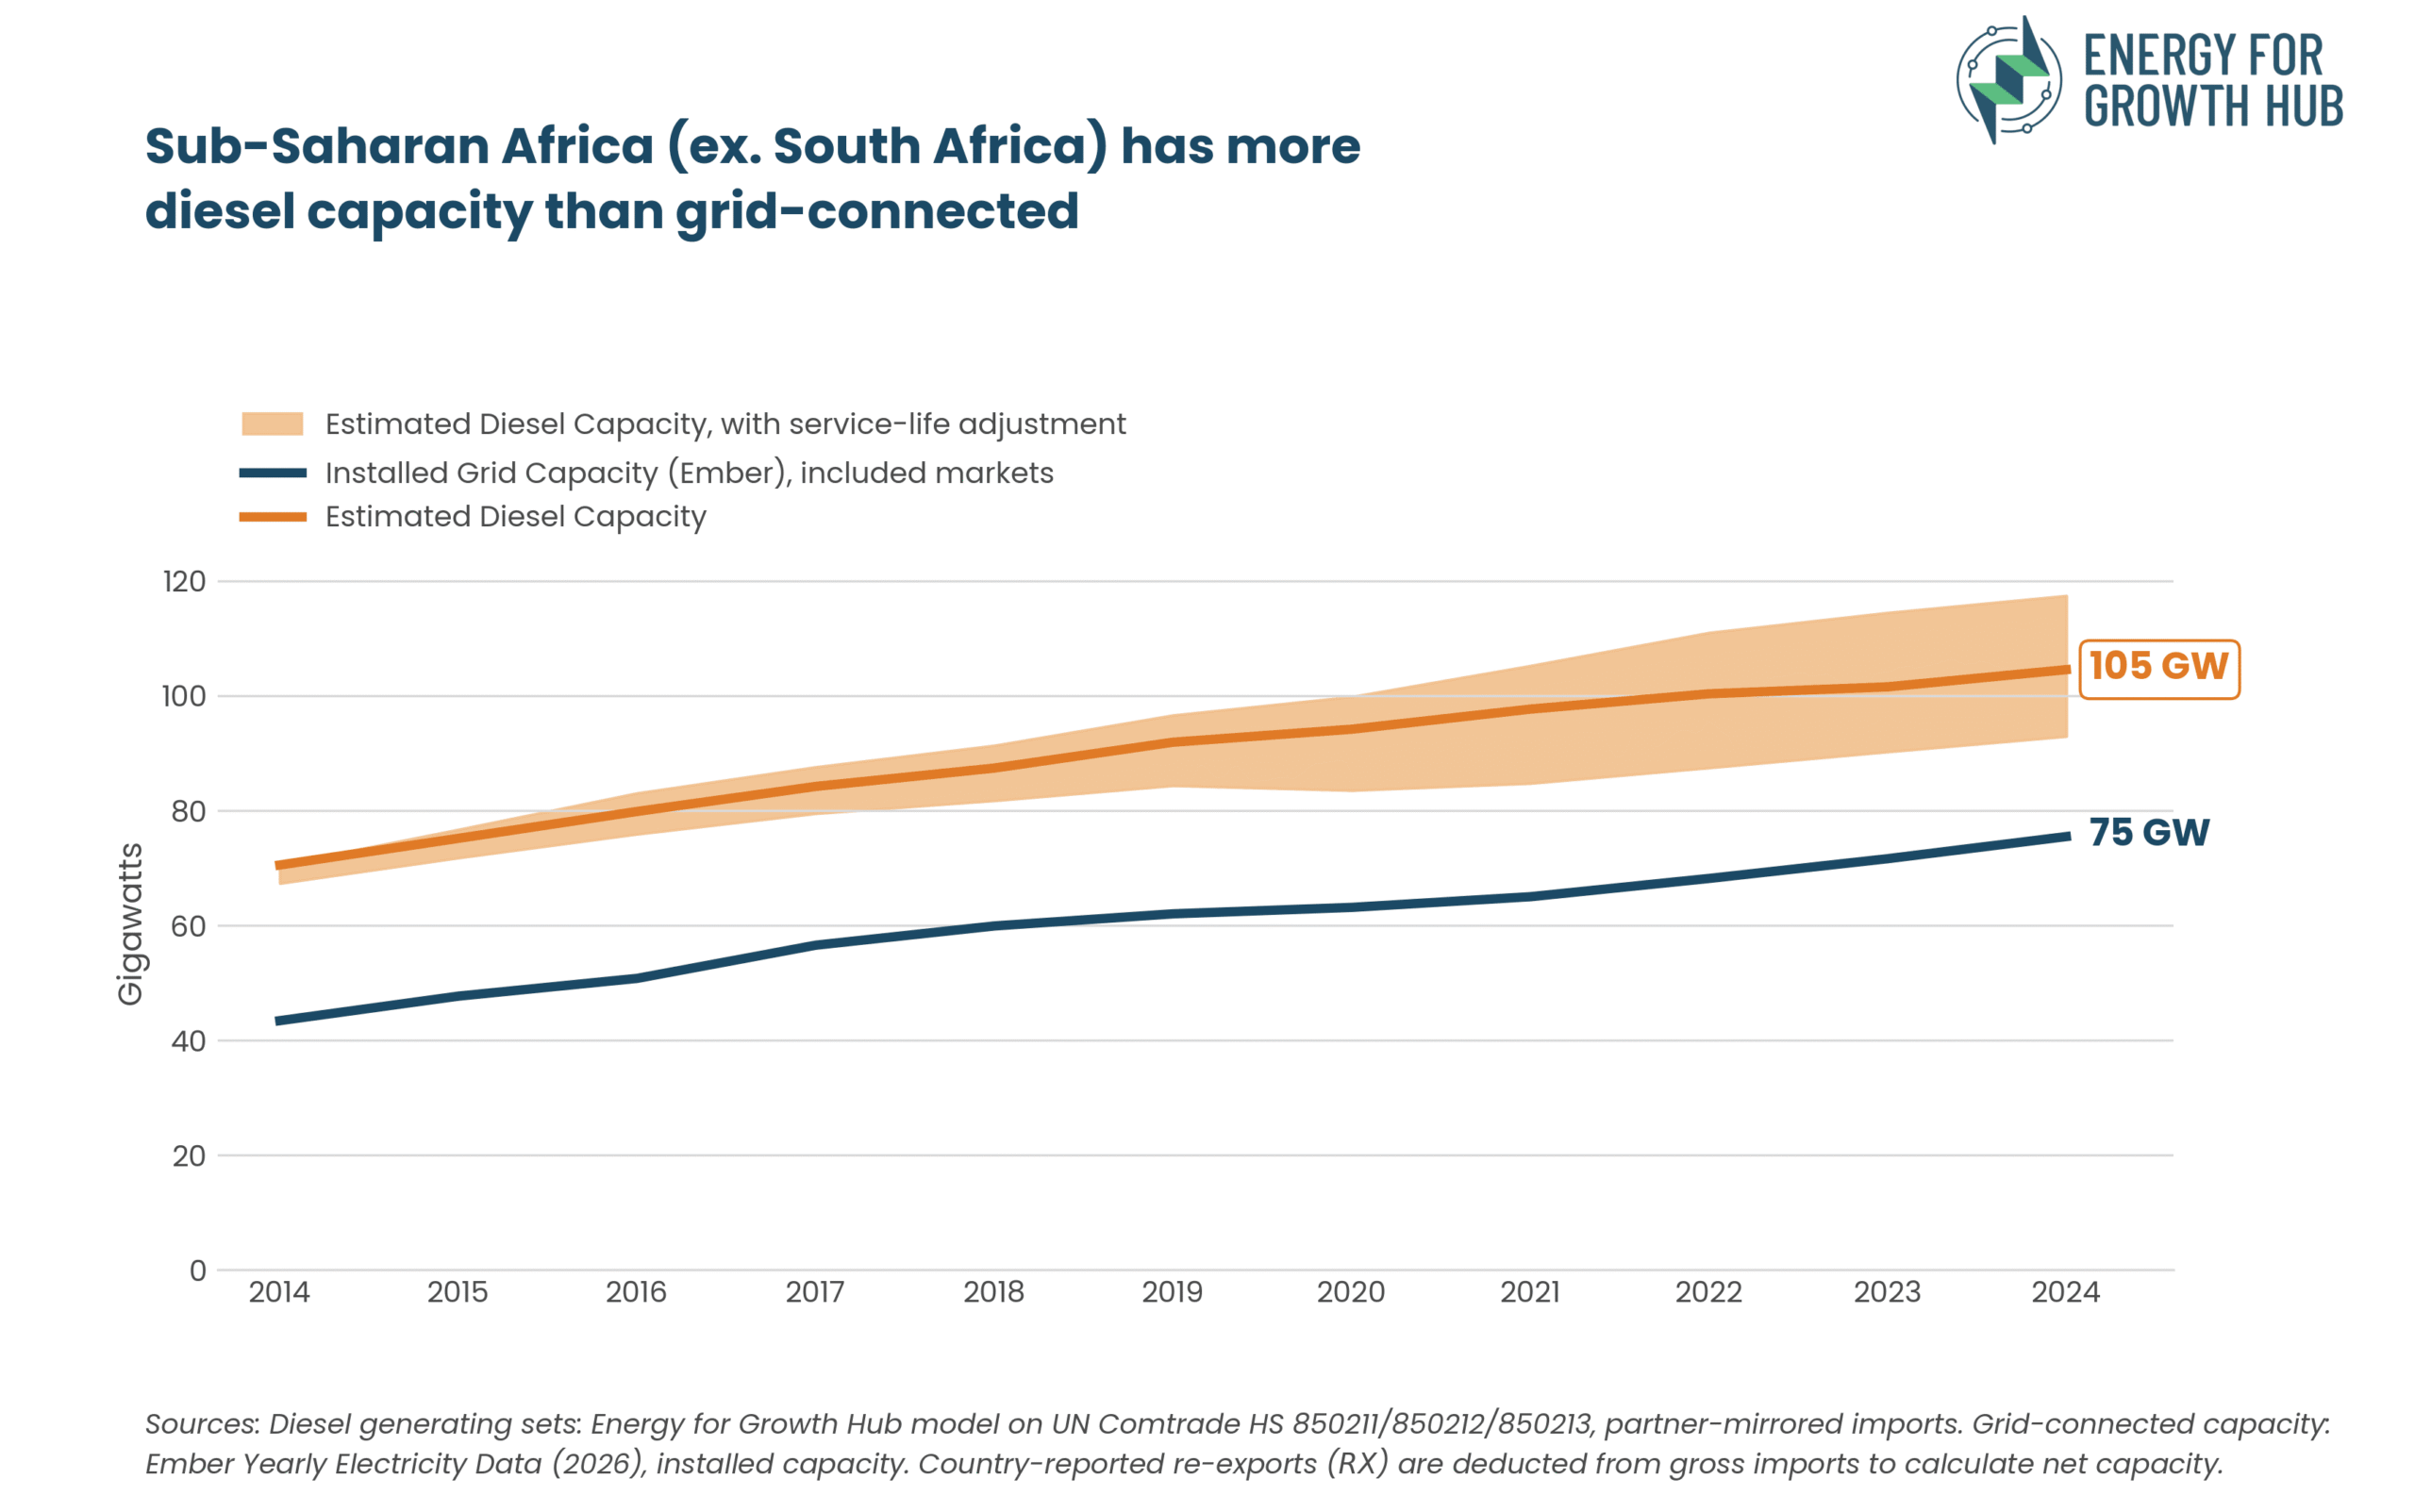
When North African countries and South Africa are removed from the total estimate, diesel capacity shows up as the overwhelming source of power. Outside of South Africa, sub-Saharan countries have nearly 1.5 times more diesel generation capacity than grid capacity. At a country level, at least 26 sub-Saharan markets have more diesel than grid power. As a result, power availability and cost remains highly exposed to recent and past diesel supply shortages and global fuel import fluctuations.
Diesel-power is expensive, yet firms and economies are paying for it
Based on import data, importers have spent $26 billion for diesel gensets since 2000, with end-consumer pricing likely significantly higher. Running the generators costs far more than grid power; effective tariffs can be at least 2-4x more than average grid tariffs. On the Hub’s own reliability-adjusted measure, the effective cost of reliable power in sub-Saharan Africa already runs 52.4% above the posted tariff. This is also regressive for smaller businesses, who typically face similar capital and operating costs amortized over lower demand, pushing the effective tariff higher and choking growth.

What is not measured, can’t get fixed
Africa’s diesel generator fleet is the invisible system helping keep commerce going while increasing the cost of doing business, reducing utility revenue, and stalling national economic growth. To remedy this negative impact and leverage the demand that this shadow grid is serving for broader economic gains:
- Grid planning agencies and energy ministries need to count captive power capacity. The captive diesel generation footprint belongs in national demand forecasts, capacity statistics, and power system planning studies, especially in markets where diesel capacity outstrips grid-generation capacity. Tracking can begin with large-scale diesel gensets. Countries can leverage National Energy Compacts and Mission 300 planning processes to begin to track, estimate, and incorporate this underserved demand in national energy planning.
- Utilities, development financiers, and power producers should target investment where the demand signal is strongest. Policymakers can direct public and private investment toward reliability, power quality, and voltage stability in areas with high generator density. Many commercial and industrial offtakers keep running diesel even when uptime improves to protect sensitive equipment from brownouts and voltage spikes. Reliability investments are already shown to be low-risk, high-return projects that help utilities win back high-paying customers and critical revenue. This also benefits development financiers seeking to expand access: financially stronger utilities are better positioned to connect and reliably serve new customers.
Africa’s shadow grid must come to light
The grid in most African countries is not clearing the market for most commercial and industrial customers. In the shadows, invisible to utilities, planners, policymakers, and development financiers, a massive off-grid system built on diesel generators has emerged as a coping mechanism. The result is a costly lose-lose for both businesses and utilities: utilities lose paying customers while businesses absorb the high and volatile costs of self-generation. Yet therein lies a powerful demand signal: every customer willing to bear the upfront, unsubsidized cost of a diesel generator is demonstrating a willingness to pay for reliable power, often for productive economic activity. It is time to bring this demand out of the shadows and into mainstream power systems planning.
Endnotes
- Wood Mackenzie, “Belching in the Background: Sizing Africa’s Distributed Diesel Power Landscape and Displacement Opportunity,” April, 2022.
- International Finance Corporation (IFC), The Dirty Footprint of the Broken Grid: The Impacts of Fossil Fuel Back-up Generators in Developing Countries (Washington, DC: IFC, 2019).
- Todd Moss, The Reliability-Adjusted Cost of Electricity (RACE): A New Metric for the Fight Against Energy Poverty, Energy for Growth Hub, October, 2019.
- Daniel Johansson, “Five Ways the Strait of Hormuz Disruptions Are Hitting African Economies (And Two Unexpected Opportunities),” Energy for Growth Hub, April, 2026.
- Jeffrey Haeni and Meron Tesfaye, “Utilities and Regulators Take Note: Reliability Investments Pay Off,” Energy for Growth Hub, October, 2025.
- Charles Lawrie and Camillo Stubenberg, “Friend or Foe? Diesel Generators and the Global Energy Transition,” Energy Research & Social Science (2025).
- Taiwo Hassan Odugbemi and Meron Tesfaye, “From Death Spiral to Economic Engine: What Five African Countries Tell Us About Firm Grid-Defection, Power Sector Health, and Economic Prosperity,” Energy for Growth Hub, August, 2026.
Methodology Appendix
(Full workbook available on request.)
This model extends and updates two prior efforts to estimate Africa’s diesel-based electricity generation capacity. The first study, the IFC’s Dirty Footprint of the Broken Grid (2019) was the first to systematically estimate capacity and cost for the shadow grid. The second study, Wood Mackenzie’s Belching in the Background (2022) report, used diesel generator and diesel fuel trade data to estimate installed diesel electricity generation capacity for 39 African markets.
Our model rebuilds the Wood Mackenzie model independently with a few modifications. This model: (1) enhances input data to include diesel generator export data from export countries and import countries (mirrored) rather than just country-reported import data; (2) nets out re-exports; (3) expands the coverage of African countries from 39 markets to 50; (4) adds a decade of historical trade data; (5) offers a sensitivity range based on economic life assumptions; (6) reframes the model insight around policy implications rather than technology displacement.
Scope and source. We estimate operational capacity from partner-reported (mirrored) trade flows in HS 850211, 850212, and 850213 — compression-ignition generating sets under 75 kilovolt-ampere (kVA), 75-375 kVA, and above 375 kVA — for 2000 to 2024, covering 51 African markets. We use mirrored trade flows rather than direct-reported imports because mirrored reporting is more comprehensive in the UN COMTRADE data.
Weight-based capacity estimates. We derive capacity entirely from reported net shipment weight, divided by a band-specific weight-to-power ratio. Weight is the most complete field in the trade record and the hardest to misreport, whereas the physical unit-count field is highly inconsistent and the value field cannot control for exogenous effects on pricing. Capacity is reported net shipment weight divided by a weight-to-power ratio: 22.5 kg/kVA below 75 kVA, 11.0 for 75–375 kVA, and 5.3 above 375 kVA. The ratios follow published manufacturer specifications for Caterpillar, Cummins, Perkins, and FG Wilson sets, and capture the fact that generating sets get lighter per kVA as they get larger. Nameplate capacity is converted from kVA to kW using a standard 0.8 power factor, making figures directly comparable to grid capacity in megawatts (MW).
Active stock and retirement modeling. In line with the IFC and Wood Mackenzie analyses, a genset is treated as economically active for 15 years from the year it was imported; therefore, the 2024 fleet comprises everything imported between 2010 and 2024. The reported range is sensitive to this assumption (e.g., a 13-year life gives 151 GW, and a 17-year life gives 191 GW), so we report a range. By comparison, assuming average unit sizes 25% smaller than our band midpoints moves the estimate only to 149 GW, and a 10% haircut to net out the weight of enclosures, packaging, and base fuel tanks moves it to 152 GW.
Benchmarks. Two independent methods on the same trade record land in the same place. Dividing customs value by band unit prices (essentially the Wood Mackenzie (2022) approach) gives 138 GW; dividing it by a flat $120/kW landed benchmark gives 161 GW. Against the published Wood Mackenzie estimates for 2019, compared like-for-like in kVA, this model yields 70.9 gigavolt-ampere (GVA) across the 20 overlapping markets against Wood Mackenzie’s 75.1 GVA just 5.6% lower. The 2010-2024 fleet cost $19.3 billion to import, or $114/kW of border value, against the $140-200/kW of replacement value implied by the IFC study; import value should sit below replacement value, and it does, by about the right margin.
Model Limitations.
- Gross additions vs. installed stock: Trade data measures historical equipment imports entering a country, not directly observed on-site operational stock.
- Transshipment vs. installed stock: Country-reported re-exports ($RX$) are deducted from gross imports to calculate net capacity. However, transshipment hubs that do not consistently file re-export flow codes in UN Comtrade (e.g., Djibouti, Côte d’Ivoire, Senegal, Cameroon) may still reflect inflated country-level stock totals. This limitation affects country-level distribution rather than the continental baseline, as those units remain installed and operational within Africa.
- Unobserved local assembly & informal flows: Domestic assembly and knock-down kit assembly are not captured, creating a downward bias for major manufacturing hubs like Nigeria. Informal imports and restricted customs entries do not appear in trade records.
- Capacity vs. utilization & spend: Nameplate capacity (GW) does not equal generation (GWh). Estimating total fuel spend relies on generalized run-hour and load-factor assumptions, which remain an active area of ongoing Hub research.
- Some markets (Rwanda, Equatorial Guinea, South Sudan, Eritrea, Somalia, Western Sahara, and Chad) are excluded due to data quality issues.